

Question: 4 : 1 6 Back Assignment 5 . docx Switch To Dark Mode Assignment 5 This assignment contains 2 parts. You need to address both
:
Back
Assignment docx
Switch To Dark Mode
Assignment
This assignment contains parts. You need to address both parts to earn full credit.
Part a Find the attached Excel File: Assignment Charts. There are excel worksheets in the excel file. Based on the instruction in each worksheet, create the following chart and provide explanation. Note: Editing the Excel file, and submit the complete excel file as the first document for this assignment.
Create a histogram about the inside diameter of metal sleeves Hint: the histogram needs to include all observations Provide your explanation about the histogram chart.
Create a scatter plot with a trend line to show the relationship between disposable income and life insurance coverage. Reach your conclusion about the two variables.
Create a Pareto Chart regarding the data about types of error in a printing company Hint: the pareto chart need to be created based on the total cost, only unit costs is given currently Discuss the results found based on the pareto chart: if management has monthly allocation of $ which areas should they tackle?
Based on the cols manufacturing data, conduct the bar chart and r chart. How to interpret the two charts?
Part b This part includes calculation questions regarding Chapter Forecasting. Show your steps to earn full credit. Note: You can either type your answer in this word file, or you can print it out, work on it and scan the file back in Im fine with either option, and whatever the option you choose, it should be the second file you turn in for this assignment.
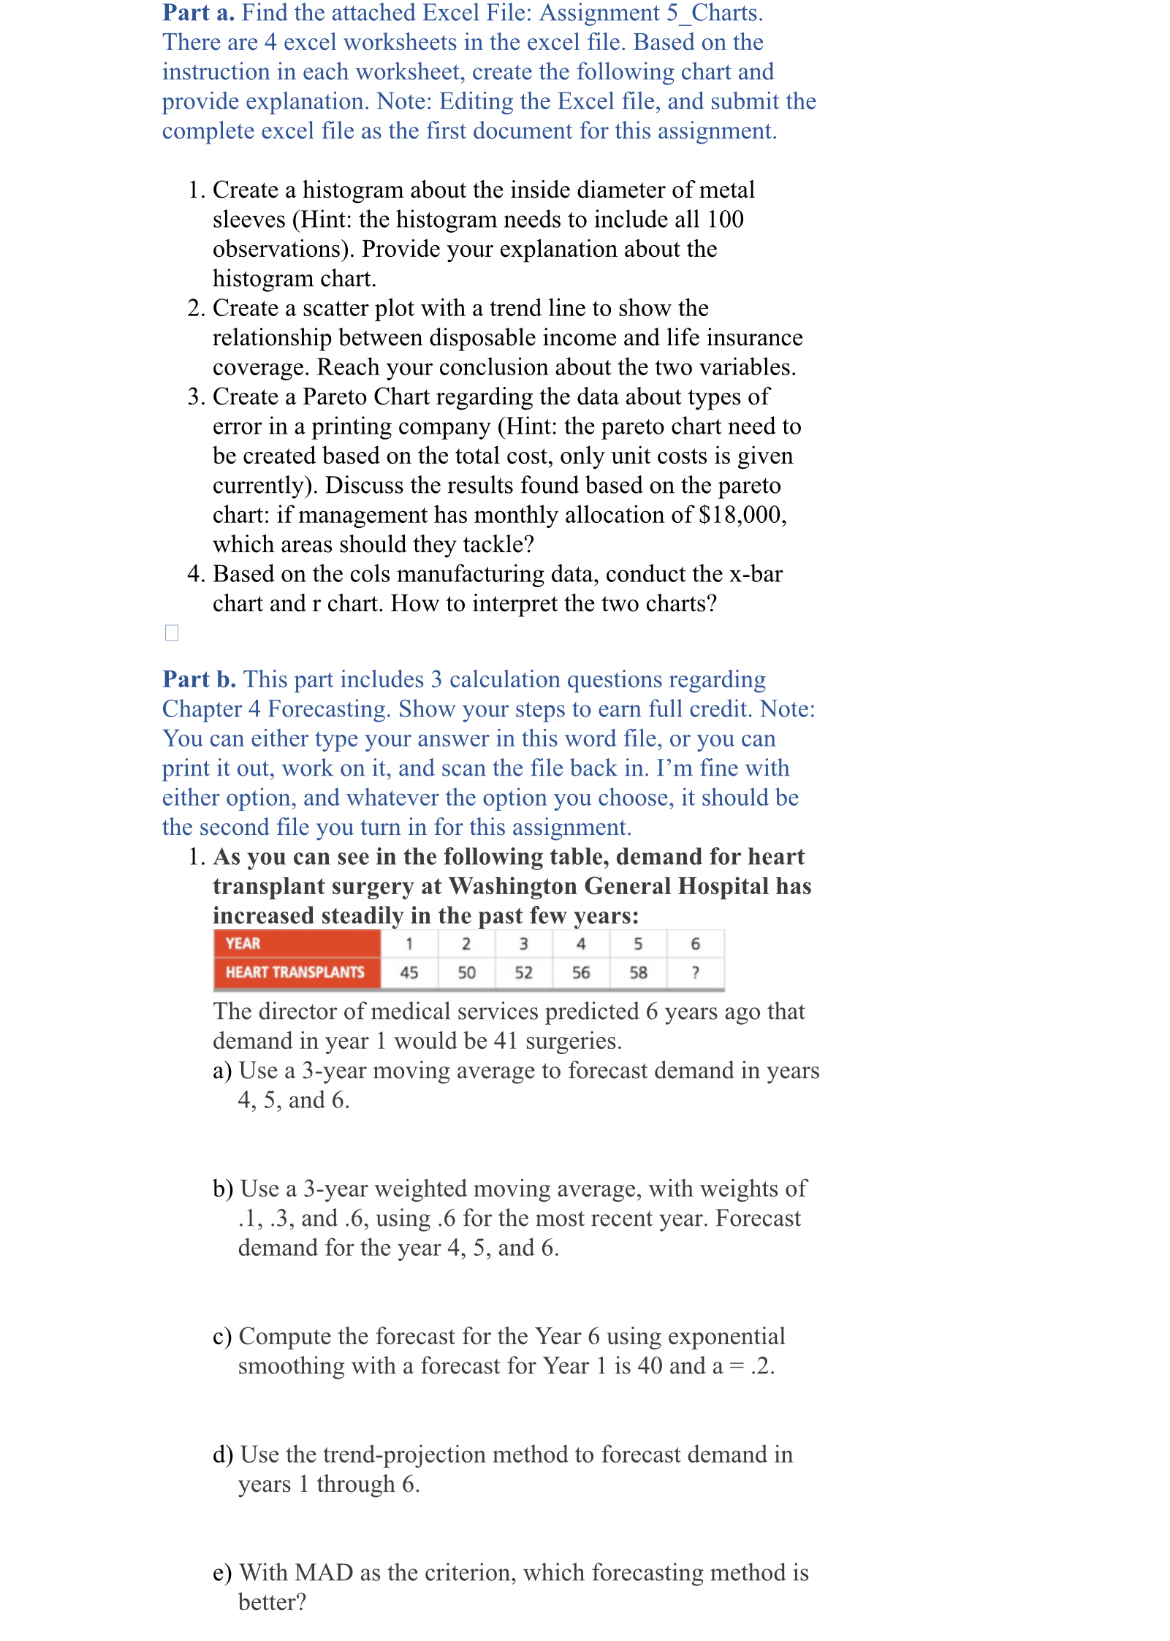
As you can see in the following table, demand for heart transplant surgery at Washington General Hospital has increased steadily in the past few years:
tableYEARHEART TRANSPLANTS,
Part a Find the attached Excel File: Assignment Charts. There are excel worksheets in the excel file. Based on the instruction in each worksheet, create the following chart and provide explanation. Note: Editing the Excel file, and submit the complete excel file as the first document for this assignment.
Create a histogram about the inside diameter of metal sleeves Hint: the histogram needs to include all observations Provide your explanation about the histogram chart.
Create a scatter plot with a trend line to show the relationship between disposable income and life insurance coverage. Reach your conclusion about the two variables.
Create a Pareto Chart regarding the data about types of error in a printing company Hint: the pareto chart need to be created based on the total cost, only unit costs is given currently Discuss the results found based on the pareto chart: if management has monthly allocation of $ which areas should they tackle?
Based on the cols manufacturing data, conduct the bar chart and r chart. How to interpret the two charts?
Part b This part includes calculation questions regarding Chapter Forecasting. Show your steps to earn full credit. Note: You can either type your answer in this word file, or you can print it out, work on it and scan the file back in Im fine with either option, and whatever the option you choose, it should be the second file you turn in for this assignment.
As you can see in the following table, demand for heart transplant surgery at Washington General Hospital has increased steadily in the past few years:
tableYEARHEART TRANSPLANTS,
Step by Step Solution
There are 3 Steps involved in it
1 Expert Approved Answer
Step: 1 Unlock

Question Has Been Solved by an Expert!
Get step-by-step solutions from verified subject matter experts
Step: 2 Unlock
Step: 3 Unlock