

Question: 4. [-11 Points] DETAILS MEN DSTAT15 1.4.009. MY NOTES ASK YOUR TEACHER PRACTICE ANOTHER Use the information given to nd a convenient class width. Then
![4. [-11 Points] DETAILS MEN DSTAT15 1.4.009. MY NOTES ASK YOUR](https://s3.amazonaws.com/si.experts.images/answers/2024/06/6676be4607e42_9896676be45d80f4.jpg)
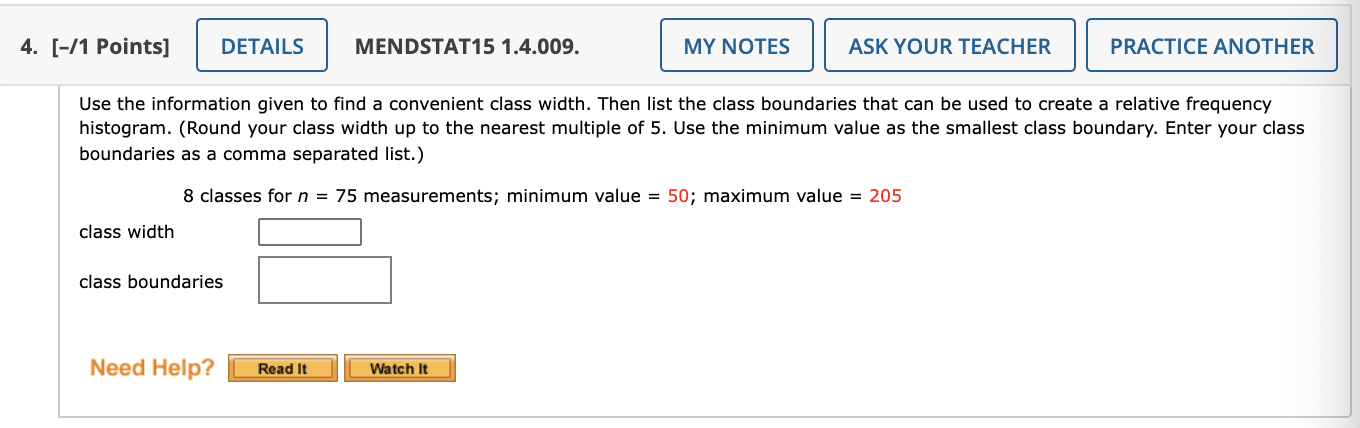
4. [-11 Points] DETAILS MEN DSTAT15 1.4.009. MY NOTES ASK YOUR TEACHER PRACTICE ANOTHER Use the information given to nd a convenient class width. Then list the class boundaries that can be used to create a relative frequency histogram. (Round your class width up to the nearest multiple of 5. Use the minimum value as the smallest class boundary. Enter your class boundaries as a comma separated list.) 8 classes for n = 75 measurements; minimum value = 50; maximum value = 205 class width ':| class boundaries |:| Need Help
Step by Step Solution
There are 3 Steps involved in it
1 Expert Approved Answer
Step: 1 Unlock

Question Has Been Solved by an Expert!
Get step-by-step solutions from verified subject matter experts
Step: 2 Unlock
Step: 3 Unlock