

Question: 4. (16 pt) When we use the CAPM model to estimate the cost of capital for a 10-year project, ideally we would like to find
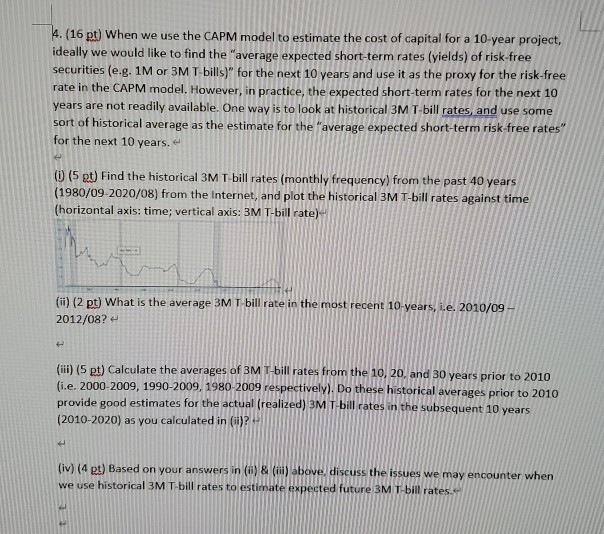
4. (16 pt) When we use the CAPM model to estimate the cost of capital for a 10-year project, ideally we would like to find the "average expected short-term rates (yields) of risk-free securities (e.g. 1M or 3M T-bills)" for the next 10 years and use it as the proxy for the risk-free rate in the CAPM model. However, in practice, the expected short-term rates for the next 10 years are not readily available. One way is to look at historical 3M T-bill rates and use some sort of historical average as the estimate for the "average expected short-term risk-free rates" for the next 10 years. (5 st) Find the historical 3M T bill rates (monthly frequency) from the past 40 years (1980/09-2020/08) from the Internet, and plot the historical 3M T-bill rates against time (horizontal axis: time; vertical axis: 3M T-bill rate) () (2 pt) What is the average 3M T bill rate in the most recent 10 years, i.e. 2010/09- 2012/08? (iii) (5 pt) Calculate the averages of 3M T-bill rates from the 10, 20, and 30 years prior to 2010 (i.e. 2000-2009, 1990-2009, 1980-2009 respectively). Do these historical averages prior to 2010 provide good estimates for the actual realized) 3M T-bill rates in the subsequent 10 years (2010-2020) as you calculated in (i)? (iv) (4 pt) Based on your answers in () & (iii) above discuss the issues we may encounter when we use historical 3M T-bill rates to estimate expected future 3M T-bill rates. 4. (16 pt) When we use the CAPM model to estimate the cost of capital for a 10-year project, ideally we would like to find the "average expected short-term rates (yields) of risk-free securities (e.g. 1M or 3M T-bills)" for the next 10 years and use it as the proxy for the risk-free rate in the CAPM model. However, in practice, the expected short-term rates for the next 10 years are not readily available. One way is to look at historical 3M T-bill rates and use some sort of historical average as the estimate for the "average expected short-term risk-free rates" for the next 10 years. (5 st) Find the historical 3M T bill rates (monthly frequency) from the past 40 years (1980/09-2020/08) from the Internet, and plot the historical 3M T-bill rates against time (horizontal axis: time; vertical axis: 3M T-bill rate) () (2 pt) What is the average 3M T bill rate in the most recent 10 years, i.e. 2010/09- 2012/08? (iii) (5 pt) Calculate the averages of 3M T-bill rates from the 10, 20, and 30 years prior to 2010 (i.e. 2000-2009, 1990-2009, 1980-2009 respectively). Do these historical averages prior to 2010 provide good estimates for the actual realized) 3M T-bill rates in the subsequent 10 years (2010-2020) as you calculated in (i)? (iv) (4 pt) Based on your answers in () & (iii) above discuss the issues we may encounter when we use historical 3M T-bill rates to estimate expected future 3M T-bill rates
Step by Step Solution
There are 3 Steps involved in it

Get step-by-step solutions from verified subject matter experts