

Question: 4 198 Chapter 1 Equations Please use the following equation(s) to help solve problems for this chapter. Equation for Per Unit Opportunity Cost Related concepts:
4
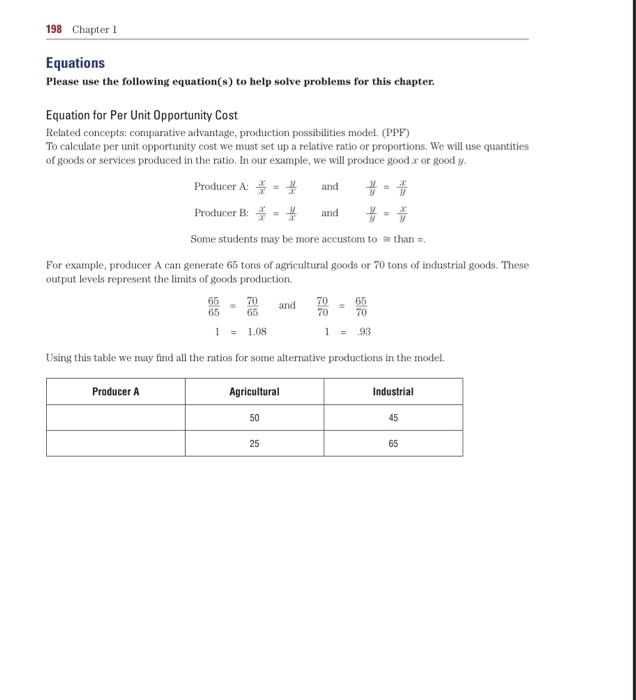
198 Chapter 1 Equations Please use the following equation(s) to help solve problems for this chapter. Equation for Per Unit Opportunity Cost Related concepts: comparative advantage, production possibilities model. (PPF) To calculate per unit opportunity cost we must set up a relative ratio or proportions. We will use quantities of goods or services produced in the ratio. In our example, we will produce good a or good y. Producer A: = = # and Producer B: # =# and # = $ Some students may be more accustom to = than =. For example, producer A can generate 65 tons of agricultural goods or 70 tons of industrial goods. These output levels represent the limits of goods production. 65 70 and 70 65 65 65 70 1.08 1 Using this table we may find all the ratios for some alternative productions in the model. Producer A Agricultural Industrial 50 45 25 65Worksheets 199 Graph Map Please graph two hypothetical production possibilities models. In one of the graphs, please construct a frontier with the two variables having a constant rate of change. In the other draw the constraint with the two goods or services having a varied rate of change. What would make the frontier linear or nonlinear
Step by Step Solution
There are 3 Steps involved in it

Get step-by-step solutions from verified subject matter experts