

Question: 4 : 2 7 C all 5 6 : 2 6 chapter _ 2 _ ASSIGN copy A B C D E F G H
: C
all :
chapterASSIGN copy
A
B
C
D
E
F
G
H
I
J
K
L
M
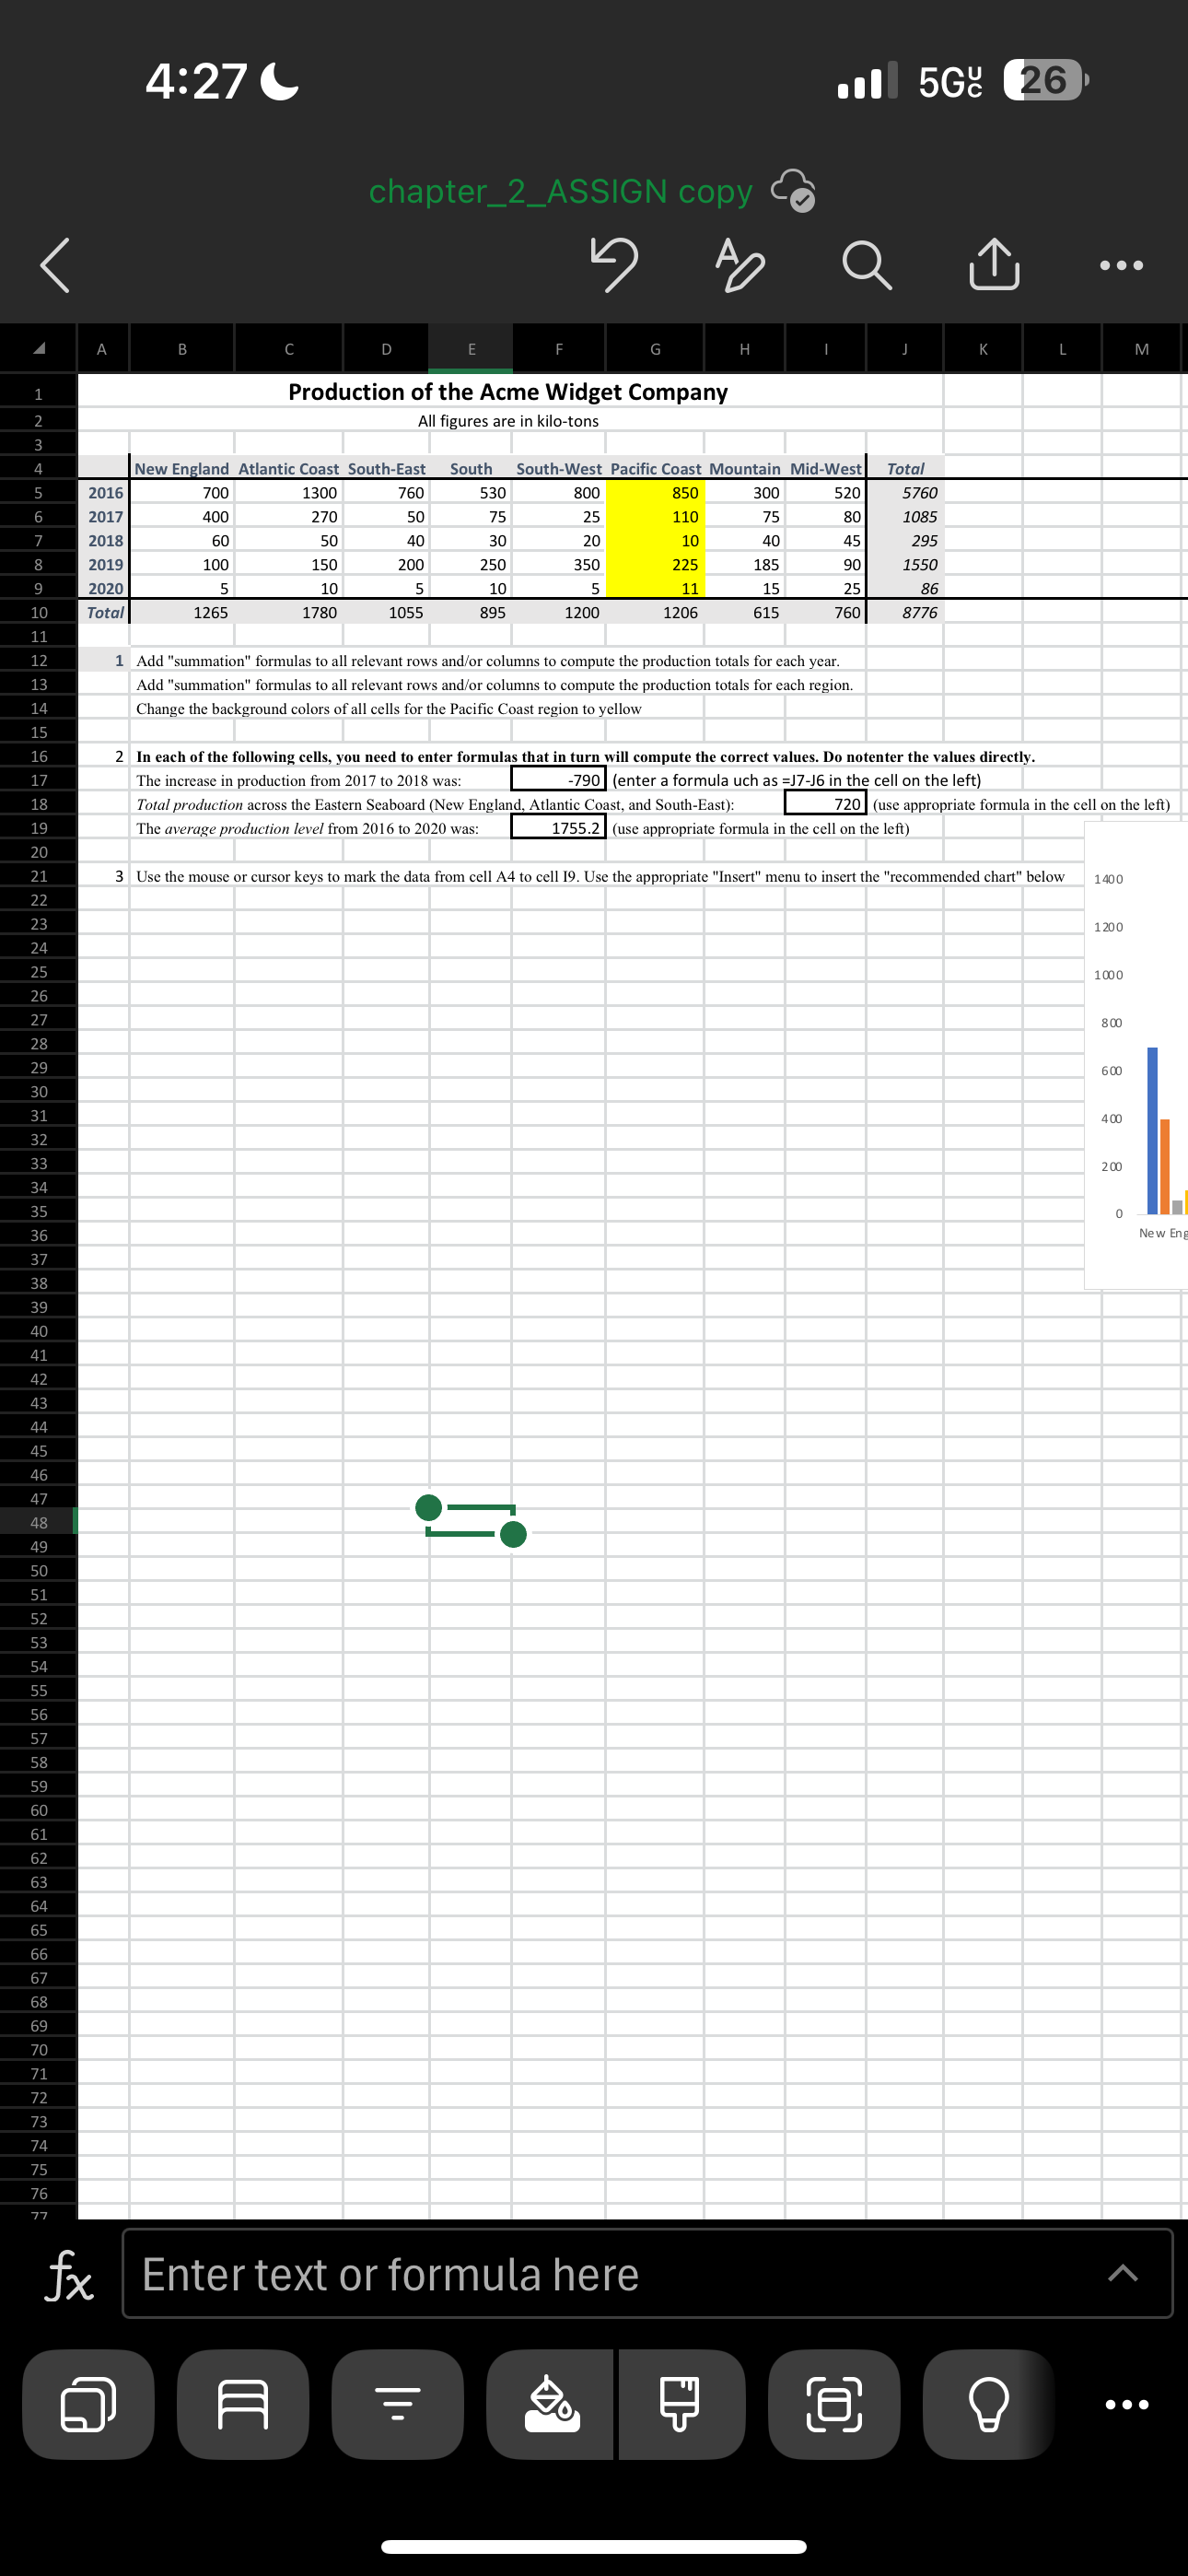
Production of the Acme Widget Company
All figures are in kilotons
Add "summation" formulas to all relevant rows andor columns to compute the production totals for each year. Add "summation" formulas to all relevant rows andor columns to compute the production totals for each region. Change the background colors of all cells for the Pacific Coast region to yellow
In each of the following cells, you need to enter formulas that in turn will compute the correct values. Do notenter the values directly. The increase in production from to was: enter a formula uch as in the cell on the left
Total production across the Eastern Seaboard New England, Atlantic Coast, and SouthEast: use appropriate formula in the cell on the left
The average production level from to was: use appropriate formula in the cell on the left
Use the mouse or cursor keys to mark the data from cell A to cell I Use the appropriate "Insert" menu to insert the "recommended chart" below
Enter text or formula here
Step by Step Solution
There are 3 Steps involved in it
1 Expert Approved Answer
Step: 1 Unlock

Question Has Been Solved by an Expert!
Get step-by-step solutions from verified subject matter experts
Step: 2 Unlock
Step: 3 Unlock