

Question: 4. [25 marks] Every year Forbes produces a data set of the top 2000 companies world-wide, ranked by quantities such as Sales and Assets, across
![4. [25 marks] Every year Forbes produces a data set of](https://dsd5zvtm8ll6.cloudfront.net/si.experts.images/questions/2024/09/66e41b5fdfec2_24766e41b5f80898.jpg)
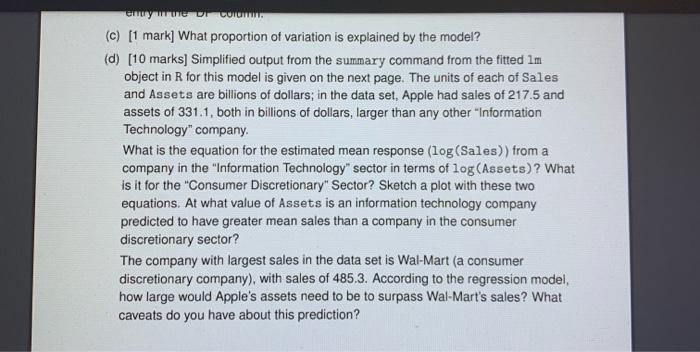
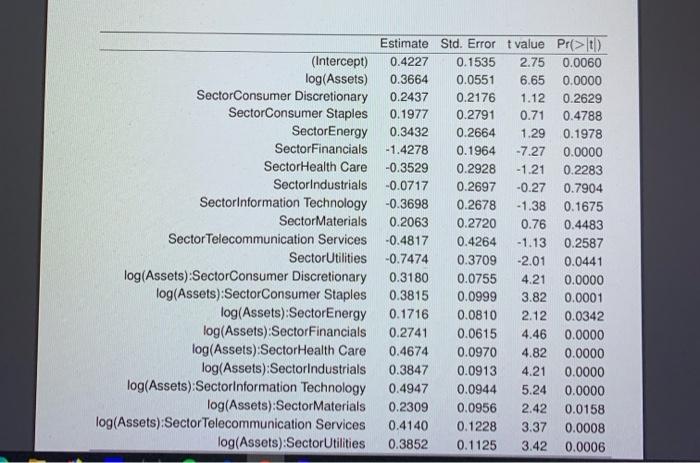
4. [25 marks] Every year Forbes produces a data set of the top 2000 companies world-wide, ranked by quantities such as Sales and Assets, across different market sectors, countries etc. A linear model was fitted to the 2017 data, regressing log (Sales) against log (Assets) (a quantitative variable) and Sector (a qualitative factor with 11 levels). The following analysis of variance table was obtained. Df Sum Sq Mean Sq F value Pr(>F) 7.7510e-136 log(Assets) ? 561.84 ? ? Sector ? ? ? 1.9527e-188 ? 893.35 38.68 ? 1539.23 ? log(Assets):Sector Residuals ? 3.7597e-07 (a) [6 marks] Write down each of the nested model comparisons summarised in this table. (b) [8 marks] Complete the ANOVA table. Give reasons for your choices for each entry in the "DF" column. (c) [1 mark] What proportion of variation is explained by the model? (d) [10 marks] Simplified output from the summary command from the fitted 1m object in R for this model is given on the next page. The units of each of Sales and Assets are billions of dollars; in the data set, Apple had sales of 217.5 and assets of 331.1, both in billions of dollars, larger than any other "Information Technology company entry in the Dr Column. (c) [1 mark] What proportion of variation is explained by the model? (d) [10 marks] Simplified output from the summary command from the fitted 1m object in R for this model is given on the next page. The units of each of Sales and Assets are billions of dollars; in the data set, Apple had sales of 217.5 and assets of 331.1, both in billions of dollars, larger than any other "Information Technology company. What is the equation for the estimated mean response (log (Sales)) from a company in the "Information Technology" sector in terms of log (Assets)? What is it for the "Consumer Discretionary" Sector? Sketch a plot with these two equations. At what value of Assets is an information technology company predicted to have greater mean sales than a company in the consumer discretionary sector? The company with largest sales in the data set is Wal-Mart (a consumer discretionary company), with sales of 485.3. According to the regression model, how large would Apple's assets need to be to surpass Wal-Mart's sales? What caveats do you have about this prediction? 0.2176 Estimate Std. Error t value Pr(>t) (Intercept) 0.4227 0.1535 2.75 0.0060 log(Assets) 0.3664 0.0551 6.65 0.0000 1.12 0.2629 0.71 0.4788 0.2664 1.29 0.1978 0.1964 -7.27 0.0000 0.2928 -1.21 0.2283 0.2791 0.2697 -0.27 0.7904 0.2678 -1.38 0.1675 0.2720 0.76 0.4483 0.4264 -1.13 0.2587 0.3709 -2.01 0.0441 0.0000 0.0755 4.21 0.0999 3.82 0.0001 2.12 0.0342 4.46 0.0000 0.0970 4.82 0.0000 0.0913 4.21 0.0000 0.0944 5.24 0.0000 0.0956 2.42 0.0158 0.1228 3.37 0.0008 0.1125 3.42 0.0006 SectorConsumer Discretionary 0.2437 SectorConsumer Staples 0.1977 SectorEnergy 0.3432 SectorFinancials -1.4278 SectorHealth Care -0.3529 SectorIndustrials -0.0717 SectorInformation Technology -0.3698 SectorMaterials 0.2063 Sector Telecommunication Services -0.4817 SectorUtilities -0.7474 log(Assets):SectorConsumer Discretionary 0.3180 log(Assets):SectorConsumer Staples 0.3815 log(Assets):SectorEnergy 0.1716 0.0810 log(Assets):Sector Financials 0.2741 0.0615 log(Assets):Sector Health Care 0.4674 log(Assets):Sectorindustrials 0.3847 log(Assets):SectorInformation Technology 0.4947 log(Assets):Sector Materials 0.2309 log(Assets):Sector Telecommunication Services 0.4140 log(Assets):Sector Utilities 0.3852 4. [25 marks] Every year Forbes produces a data set of the top 2000 companies world-wide, ranked by quantities such as Sales and Assets, across different market sectors, countries etc. A linear model was fitted to the 2017 data, regressing log (Sales) against log (Assets) (a quantitative variable) and Sector (a qualitative factor with 11 levels). The following analysis of variance table was obtained. Df Sum Sq Mean Sq F value Pr(>F) 7.7510e-136 log(Assets) ? 561.84 ? ? Sector ? ? ? 1.9527e-188 ? 893.35 38.68 ? 1539.23 ? log(Assets):Sector Residuals ? 3.7597e-07 (a) [6 marks] Write down each of the nested model comparisons summarised in this table. (b) [8 marks] Complete the ANOVA table. Give reasons for your choices for each entry in the "DF" column. (c) [1 mark] What proportion of variation is explained by the model? (d) [10 marks] Simplified output from the summary command from the fitted 1m object in R for this model is given on the next page. The units of each of Sales and Assets are billions of dollars; in the data set, Apple had sales of 217.5 and assets of 331.1, both in billions of dollars, larger than any other "Information Technology company entry in the Dr Column. (c) [1 mark] What proportion of variation is explained by the model? (d) [10 marks] Simplified output from the summary command from the fitted 1m object in R for this model is given on the next page. The units of each of Sales and Assets are billions of dollars; in the data set, Apple had sales of 217.5 and assets of 331.1, both in billions of dollars, larger than any other "Information Technology company. What is the equation for the estimated mean response (log (Sales)) from a company in the "Information Technology" sector in terms of log (Assets)? What is it for the "Consumer Discretionary" Sector? Sketch a plot with these two equations. At what value of Assets is an information technology company predicted to have greater mean sales than a company in the consumer discretionary sector? The company with largest sales in the data set is Wal-Mart (a consumer discretionary company), with sales of 485.3. According to the regression model, how large would Apple's assets need to be to surpass Wal-Mart's sales? What caveats do you have about this prediction? 0.2176 Estimate Std. Error t value Pr(>t) (Intercept) 0.4227 0.1535 2.75 0.0060 log(Assets) 0.3664 0.0551 6.65 0.0000 1.12 0.2629 0.71 0.4788 0.2664 1.29 0.1978 0.1964 -7.27 0.0000 0.2928 -1.21 0.2283 0.2791 0.2697 -0.27 0.7904 0.2678 -1.38 0.1675 0.2720 0.76 0.4483 0.4264 -1.13 0.2587 0.3709 -2.01 0.0441 0.0000 0.0755 4.21 0.0999 3.82 0.0001 2.12 0.0342 4.46 0.0000 0.0970 4.82 0.0000 0.0913 4.21 0.0000 0.0944 5.24 0.0000 0.0956 2.42 0.0158 0.1228 3.37 0.0008 0.1125 3.42 0.0006 SectorConsumer Discretionary 0.2437 SectorConsumer Staples 0.1977 SectorEnergy 0.3432 SectorFinancials -1.4278 SectorHealth Care -0.3529 SectorIndustrials -0.0717 SectorInformation Technology -0.3698 SectorMaterials 0.2063 Sector Telecommunication Services -0.4817 SectorUtilities -0.7474 log(Assets):SectorConsumer Discretionary 0.3180 log(Assets):SectorConsumer Staples 0.3815 log(Assets):SectorEnergy 0.1716 0.0810 log(Assets):Sector Financials 0.2741 0.0615 log(Assets):Sector Health Care 0.4674 log(Assets):Sectorindustrials 0.3847 log(Assets):SectorInformation Technology 0.4947 log(Assets):Sector Materials 0.2309 log(Assets):Sector Telecommunication Services 0.4140 log(Assets):Sector Utilities 0.3852
Step by Step Solution
There are 3 Steps involved in it

Get step-by-step solutions from verified subject matter experts