

Question: 4) (25 points) Consider the regression output below. Here we regress VARIABLE on a quadratic trend and some monthly seasonal dummies. (The variable TIME takes
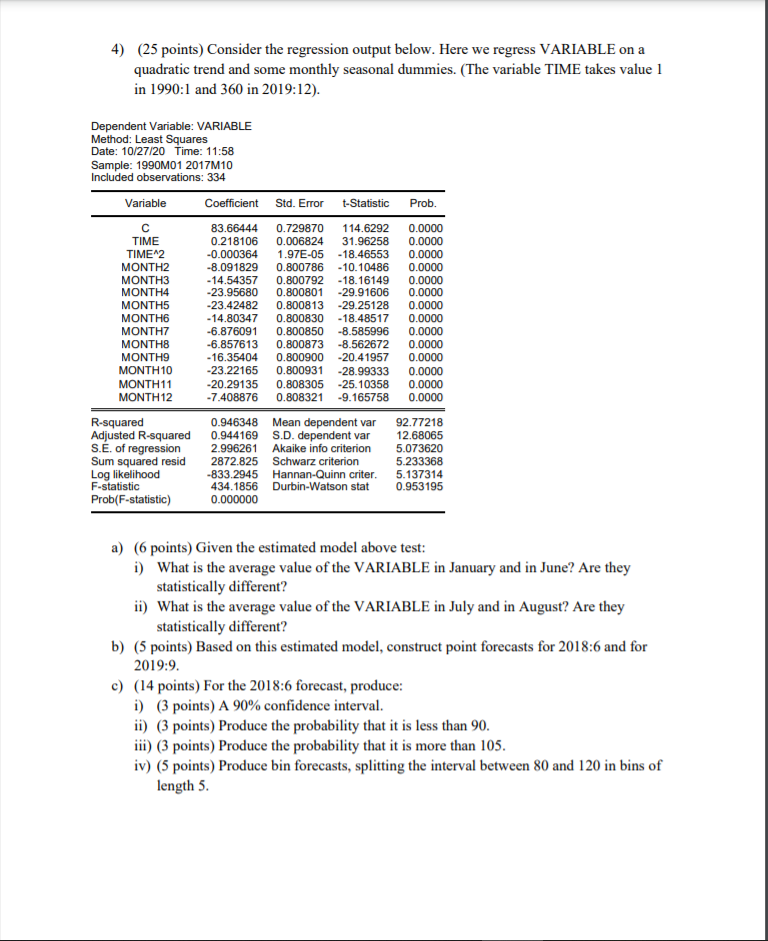
4) (25 points) Consider the regression output below. Here we regress VARIABLE on a quadratic trend and some monthly seasonal dummies. (The variable TIME takes value 1 in 1990:1 and 360 in 2019:12). Dependent Variable: VARIABLE Method: Least Squares Date: 10/27/20 Time: 11:58 Sample: 1990M01 2017M10 Included observations: 334 Variable Coefficient Std. Error t-Statistic Prob. 83.66444 0.729870 114.6292 0.0000 TIME 0.218106 0.006824 31.96258 0.0000 TIME^2 -0.000364 1.97E-05 -18.46553 0.0000 MONTH2 -8.091829 0.800786 -10.10486 0.0000 MONTH3 -14.54357 0.800792 - 18.16149 0.0000 MONTH4 -23.95680 0.800801 -29.91606 0.0000 MONTH5 -23.42482 0.800813 -29.25128 0.0000 MONTH6 -14.80347 0.800830-18.48517 0.0000 MONTH7 -6.876091 0.800850 -8.585996 0.0000 MONTHS -6.857613 0.800873 -8.562672 0.0000 MONTH9 -16.35404 0.800900 -20.41957 0.0000 MONTH10 -23.22165 0.800931 -28.99333 0.0000 MONTH11 -20.29135 0.808305 -25.10358 0.0000 MONTH12 -7.408876 0.808321 -9.165758 0.0000 R-squared 0.946348 Mean dependent var 92.77218 Adjusted R-squared 0.944169 S.D. dependent var 12.68065 S.E. of regression 2.996261 Akaike info criterion 5.073620 Sum squared resid 2872.825 Schwarz criterion 5.233368 Log likelihood -833.2945 Hannan-Quinn criter. 5.137314 F-statistic 434.1856 Durbin-Watson stat 0.953195 Prob(F-statistic) 0.000000 a) (6 points) Given the estimated model above test: i) What is the average value of the VARIABLE in January and in June? Are they statistically different? ii) What is the average value of the VARIABLE in July and in August? Are they statistically different? b) (5 points) Based on this estimated model, construct point forecasts for 2018:6 and for 2019:9. c) (14 points) For the 2018:6 forecast, produce: i) (3 points) A 90% confidence interval. ii) (3 points) Produce the probability that it is less than 90. iii) (3 points) Produce the probability that it is more than 105. iv) (5 points) Produce bin forecasts, splitting the interval between 80 and 120 in bins of length 5. 4) (25 points) Consider the regression output below. Here we regress VARIABLE on a quadratic trend and some monthly seasonal dummies. (The variable TIME takes value 1 in 1990:1 and 360 in 2019:12). Dependent Variable: VARIABLE Method: Least Squares Date: 10/27/20 Time: 11:58 Sample: 1990M01 2017M10 Included observations: 334 Variable Coefficient Std. Error t-Statistic Prob. 83.66444 0.729870 114.6292 0.0000 TIME 0.218106 0.006824 31.96258 0.0000 TIME^2 -0.000364 1.97E-05 -18.46553 0.0000 MONTH2 -8.091829 0.800786 -10.10486 0.0000 MONTH3 -14.54357 0.800792 - 18.16149 0.0000 MONTH4 -23.95680 0.800801 -29.91606 0.0000 MONTH5 -23.42482 0.800813 -29.25128 0.0000 MONTH6 -14.80347 0.800830-18.48517 0.0000 MONTH7 -6.876091 0.800850 -8.585996 0.0000 MONTHS -6.857613 0.800873 -8.562672 0.0000 MONTH9 -16.35404 0.800900 -20.41957 0.0000 MONTH10 -23.22165 0.800931 -28.99333 0.0000 MONTH11 -20.29135 0.808305 -25.10358 0.0000 MONTH12 -7.408876 0.808321 -9.165758 0.0000 R-squared 0.946348 Mean dependent var 92.77218 Adjusted R-squared 0.944169 S.D. dependent var 12.68065 S.E. of regression 2.996261 Akaike info criterion 5.073620 Sum squared resid 2872.825 Schwarz criterion 5.233368 Log likelihood -833.2945 Hannan-Quinn criter. 5.137314 F-statistic 434.1856 Durbin-Watson stat 0.953195 Prob(F-statistic) 0.000000 a) (6 points) Given the estimated model above test: i) What is the average value of the VARIABLE in January and in June? Are they statistically different? ii) What is the average value of the VARIABLE in July and in August? Are they statistically different? b) (5 points) Based on this estimated model, construct point forecasts for 2018:6 and for 2019:9. c) (14 points) For the 2018:6 forecast, produce: i) (3 points) A 90% confidence interval. ii) (3 points) Produce the probability that it is less than 90. iii) (3 points) Produce the probability that it is more than 105. iv) (5 points) Produce bin forecasts, splitting the interval between 80 and 120 in bins of length 5
Step by Step Solution
There are 3 Steps involved in it
1 Expert Approved Answer
Step: 1 Unlock

Question Has Been Solved by an Expert!
Get step-by-step solutions from verified subject matter experts
Step: 2 Unlock
Step: 3 Unlock