

Question: 4. (25 points total) Electroencephalograms are records showing electrical activity of the brain. Among the several different kinds of brain waves, the dominant ones produced
4. (25 points total) Electroencephalograms are records showing electrical activity of the brain. Among the several different kinds of brain waves, the dominant ones produced are usually alpha waves. To determine whether sensory deprivation over an extended period has a deleterious effect on the alpha brain wave pattern, 20 inmates who "volunteered" were randomly split into two equal sized groups. Members of one group were placed in solitary confinement. Those in the other group remained in their cell. Seven days later, alpha-wave frequencies were measured for all 20 subjects. Below is the SAS output
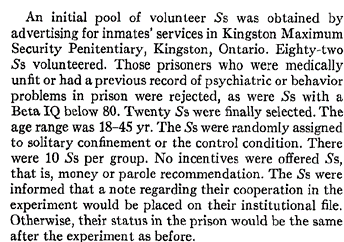
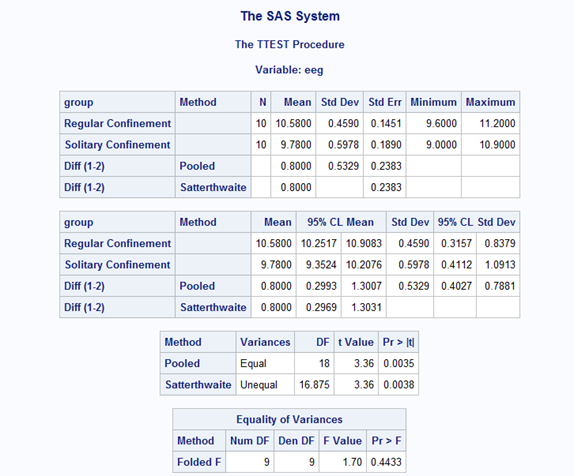
An initial pool of volunteer Ss was obtained by advertising for inmates' services in Kingston Maximum Security Penitentiary, Kingston, Ontario. Eighty-two S's volunteered. Those prisoners who were medically unfit or had a previous record of psychiatric or behavior problems in prison were rejected, as were Ss with a Beta IQ below 80. Twenty Ss were finally selected. The age range was 18-45 yr. The Ss were randomly assigned to solitary confinement or the control condition. There were 10 Ss per group. No incentives were offered Ss that is, money or parole recommendation. The Ss were informed that a note regarding their cooperation in the experiment would be placed on their institutional file. Otherwise, their status in the prison would be the same after the experiment as before.The SAS System The TTEST Procedure Variable: eeg group Method N Mean Std Dev Std Err Minimum Maximum Regular Confinement 10 10.5800 0.4590 0. 1451 9.6000 11.2000 Solitary Confinement 10 9.7800 0.5978 0. 1890 9.0000 10.9000 Diff (1-2) Pooled 0.8000 0.5329 0.2383 Diff (1-2) Satterthwaite 0.8000 0.2383 group Method Mean 95% CL Mean Std Dev 95% CL Std Dev Regular Confinement 10.5800 10 2517 10.9083 0.4590 0.3157 0.8379 Solitary Confinement 9.7800 9.3524 10.2076 0.5978 0.4112 1.0913 Diff (1-2) Pooled 0.8000 0.2993 1.3007 0.5329 0.4027 0.7881 Diff (1-2) Satterthwaite 0.8000 0.2969 1.3031 Method Variances DF t Value Pr > [t) Pooled Equal 18 3.36 0.0035 Satterthwaite Unequal 16.875 3.36 0.0038 Equality of Variances Method Num DF Den DF F Value Pr > F Folded F 9 1.70 0.4433
Step by Step Solution
There are 3 Steps involved in it

Get step-by-step solutions from verified subject matter experts