

Question: 4 3. Below is a frequency table (a type of histogram) which records the approximate time it took for a realtor to sell certain types
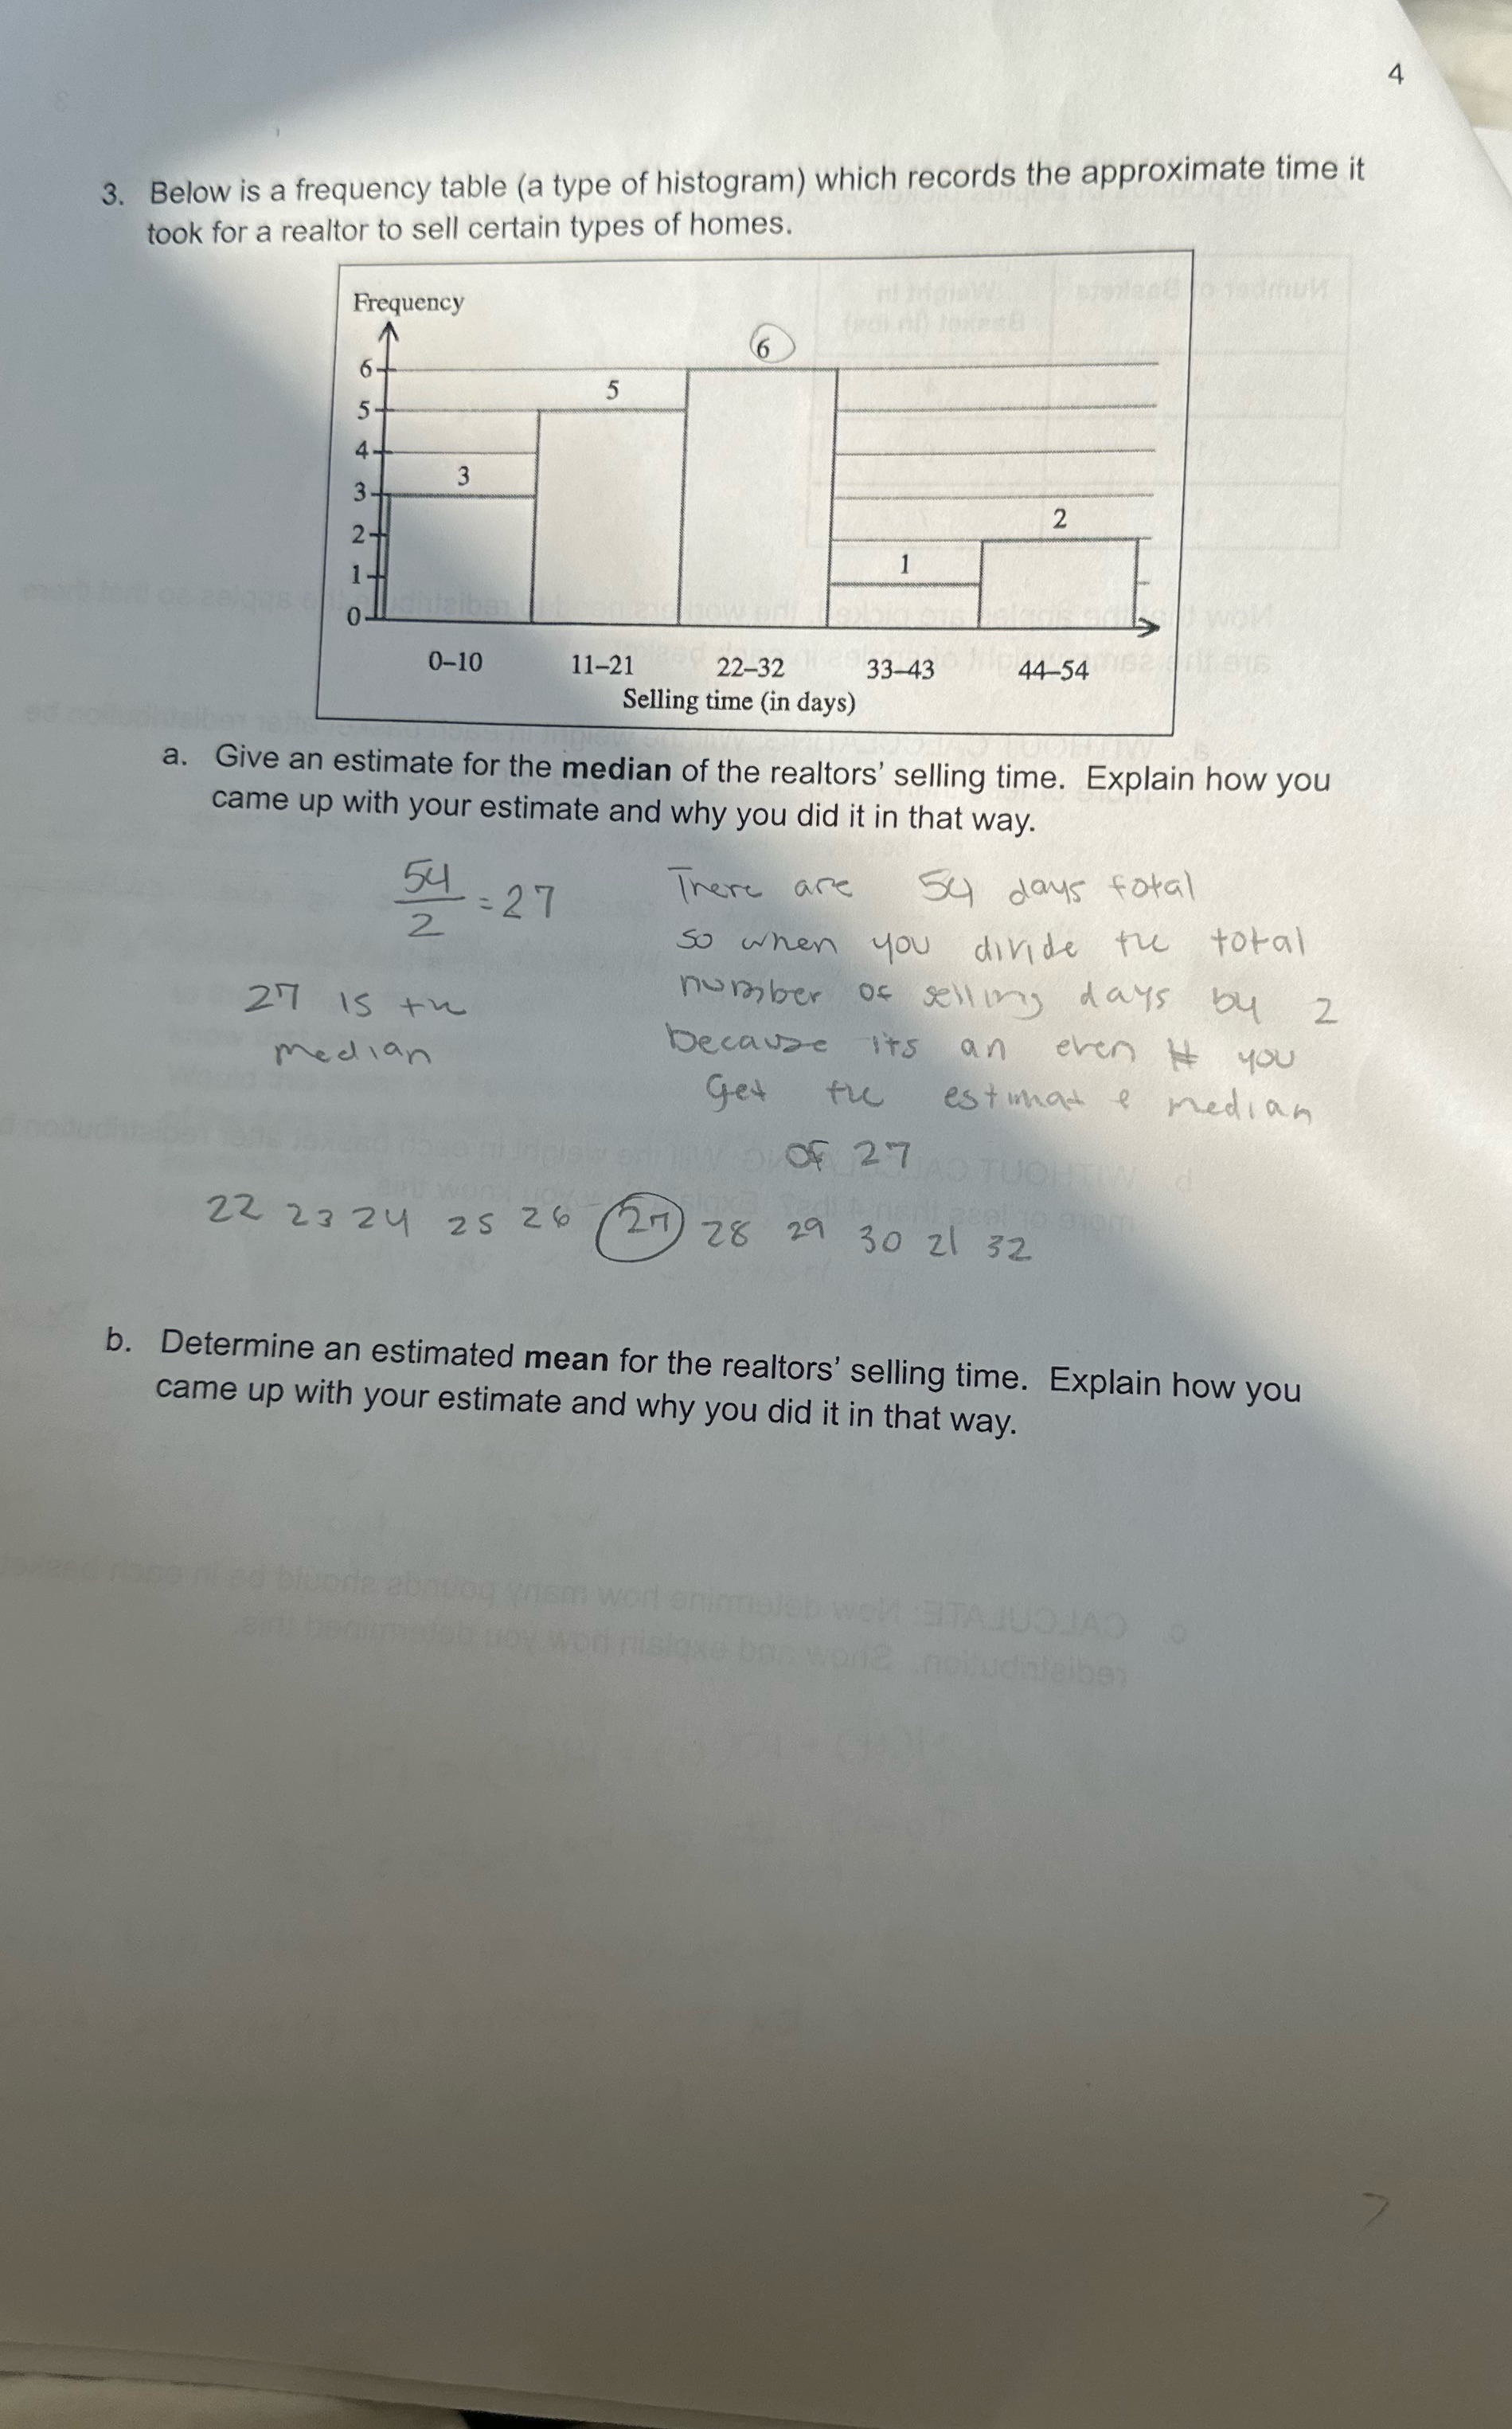
4 3. Below is a frequency table (a type of histogram) which records the approximate time it took for a realtor to sell certain types of homes. Frequency 6 6- 5 5 - 4- 3 3- 2 2- 1 0-10 11-21 22-32 33-43 44-54 Selling time (in days) a. Give an estimate for the median of the realtors' selling time. Explain how you came up with your estimate and why you did it in that way. 54 = 27 There are 54 days fotal 2 so when you divide the total 27 is the number of selling days by 2 median because it's an even # you get the estimate median OF 27 ASTUOLIN 22 23 24 25 26 28 29 30 21 32 b. Determine an estimated mean for the realtors' selling time. Explain how you came up with your estimate and why you did it in that way. HETAJUOJAO Wore nolludhleiber
Step by Step Solution
There are 3 Steps involved in it

Get step-by-step solutions from verified subject matter experts