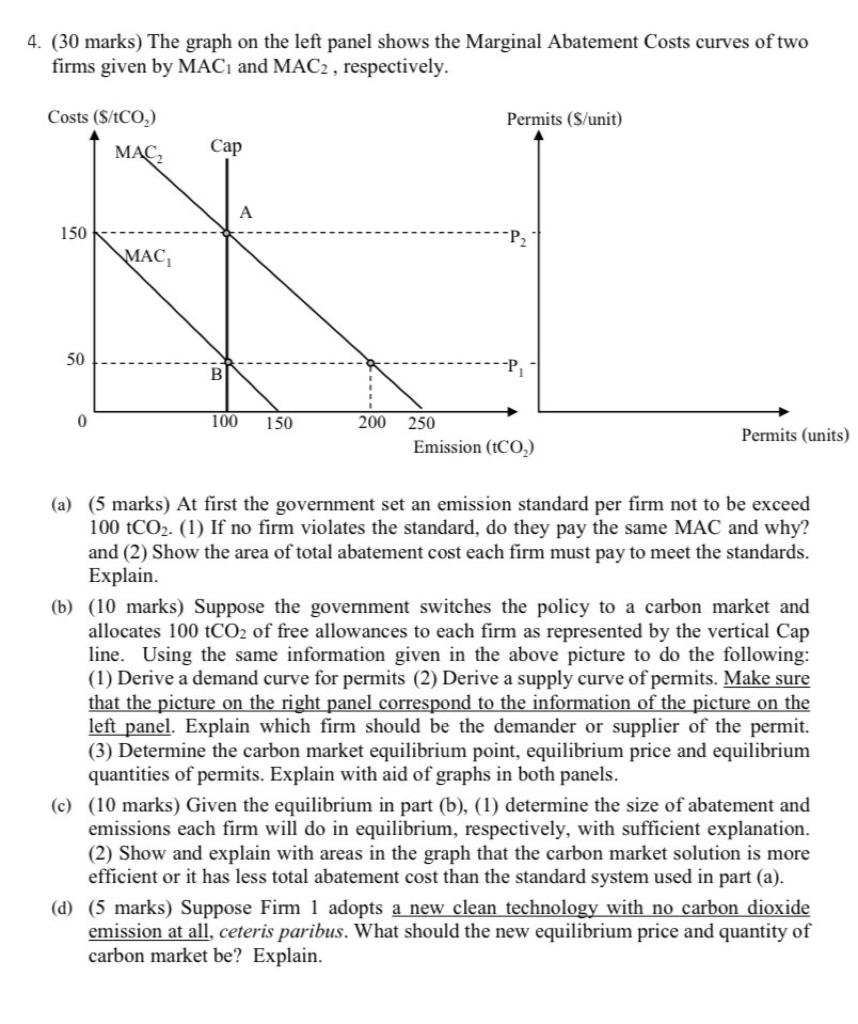
Question: 4. (30 marks) The graph on the left panel shows the Marginal Abatement Costs curves of two firms given by MAC and MAC2, respectively. Costs

4. (30 marks) The graph on the left panel shows

4. (30 marks) The graph on the left panel shows the Marginal Abatement Costs curves of two firms given by MAC and MAC2, respectively. Costs (S/CO) Permits (S/unit) MACZ Cap A 150 , 50 B -P 0 100 150 200 250 Emission (tCO) Permits (units) (a) (5 marks) At first the government set an emission standard per firm not to be exceed 100 tCO2. (1) If no firm violates the standard, do they pay the same MAC and why? and (2) Show the area of total abatement cost each firm must pay to meet the standards. Explain. (b) (10 marks) Suppose the government switches the policy to a carbon market and allocates 100 tCO2 of free allowances to each firm as represented by the vertical Cap line. Using the same information given in the above picture to do the following: (1) Derive a demand curve for permits (2) Derive a supply curve of permits. Make sure that the picture on the right panel correspond to the information of the picture on the left panel. Explain which firm should be the demander or supplier of the permit. (3) Determine the carbon market equilibrium point, equilibrium price and equilibrium quantities of permits. Explain with aid of graphs in both panels. (c) (10 marks) Given the equilibrium in part (b), (1) determine the size of abatement and emissions each firm will do in equilibrium, respectively, with sufficient explanation. (2) Show and explain with areas in the graph that the carbon market solution is more efficient or it has less total abatement cost than the standard system used in part (a). (d) (5 marks) Suppose Firm 1 adopts a new clean technology with no carbon dioxide emission at all, ceteris paribus. What should the new equilibrium price and quantity of carbon market be? Explain. 4. (30 marks) The graph on the left panel shows the Marginal Abatement Costs curves of two firms given by MAC and MAC2, respectively. Costs (S/CO) Permits (S/unit) MACZ Cap A 150 , 50 B -P 0 100 150 200 250 Emission (tCO) Permits (units) (a) (5 marks) At first the government set an emission standard per firm not to be exceed 100 tCO2. (1) If no firm violates the standard, do they pay the same MAC and why? and (2) Show the area of total abatement cost each firm must pay to meet the standards. Explain. (b) (10 marks) Suppose the government switches the policy to a carbon market and allocates 100 tCO2 of free allowances to each firm as represented by the vertical Cap line. Using the same information given in the above picture to do the following: (1) Derive a demand curve for permits (2) Derive a supply curve of permits. Make sure that the picture on the right panel correspond to the information of the picture on the left panel. Explain which firm should be the demander or supplier of the permit. (3) Determine the carbon market equilibrium point, equilibrium price and equilibrium quantities of permits. Explain with aid of graphs in both panels. (c) (10 marks) Given the equilibrium in part (b), (1) determine the size of abatement and emissions each firm will do in equilibrium, respectively, with sufficient explanation. (2) Show and explain with areas in the graph that the carbon market solution is more efficient or it has less total abatement cost than the standard system used in part (a). (d) (5 marks) Suppose Firm 1 adopts a new clean technology with no carbon dioxide emission at all, ceteris paribus. What should the new equilibrium price and quantity of carbon market be? Explain

Step by Step Solution

There are 3 Steps involved in it

1 Expert Approved Answer
Step: 1 Unlock blur-text-image
Question Has Been Solved by an Expert!

Get step-by-step solutions from verified subject matter experts

Step: 2 Unlock
Step: 3 Unlock

Students Have Also Explored These Related General Management Questions!