

Question: 4. (30 points) Load the MASS library. Within this library is a dataset called UScereal (you should read the help summary regarding this dataset). Note
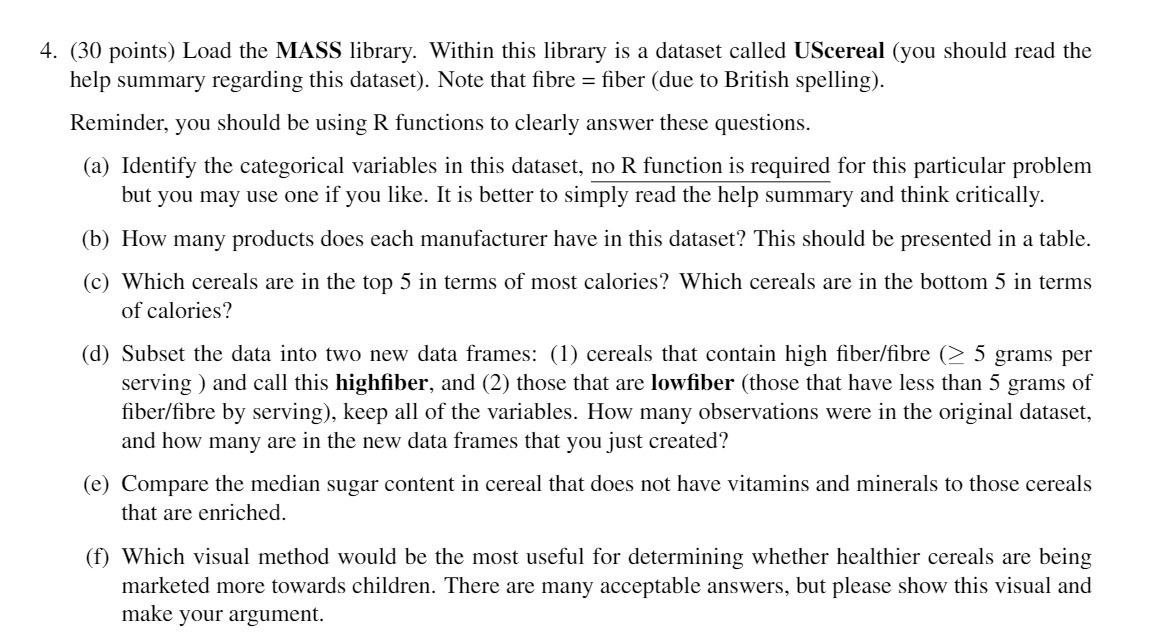
4. (30 points) Load the MASS library. Within this library is a dataset called UScereal (you should read the help summary regarding this dataset). Note that bre = ber (due to British spelling). Reminder, you should be using R functions to clearly answer these questions. (a) Identify the categorical variables in this dataset, no R function is required for this particular problem but you may use one if you like. It is better to simply read the help summary and think critically. (b) How many products does each manufacturer have in this dataset? This should be presented in a table. (c) Which cereals are in the top 5 in terms of most calories? Which cereals are in the bottom 5 in terms of calories? (d) Subset the data into two new data frames: (1) cereals that contain high berr'bre (2 5 grams per serving ) and call this highber, and (2) those that are lowber (those that have less than 5 grams of berr'bre by serving), keep all of the variables. How many observations were in the original dataset, and how many are in the new data frames that you just created? (e) Compare the median sugar content in cereal that does not have vitamins and minerals to those cereals that are enriched. (f) Which visual method would be the most useful for determining whether healthier cereals are being marketed more towards children. There are many acceptable answers, but please show this visual and make your argument
Step by Step Solution
There are 3 Steps involved in it

Get step-by-step solutions from verified subject matter experts