

Question: 4 5 6 7 8 9 Given Data: 10 11 12 13 14 Month January February March April May June Bottles Sold 1000 1100 1300
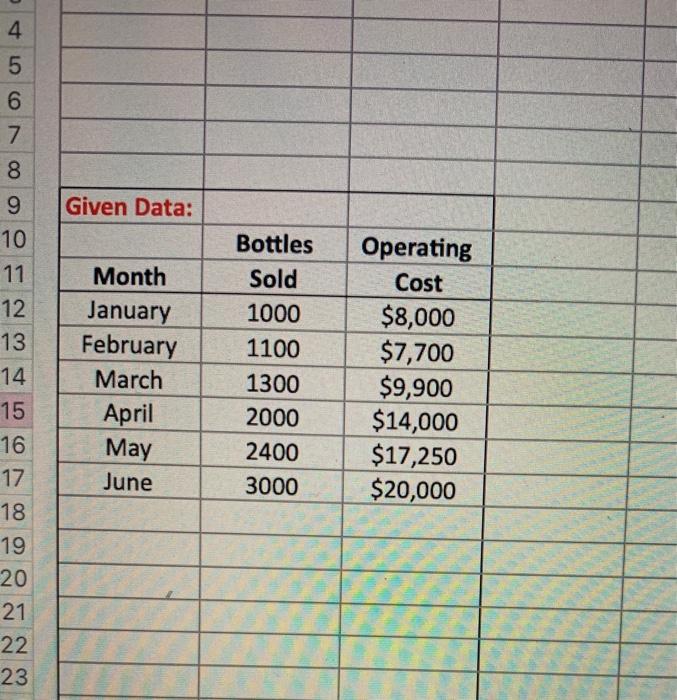
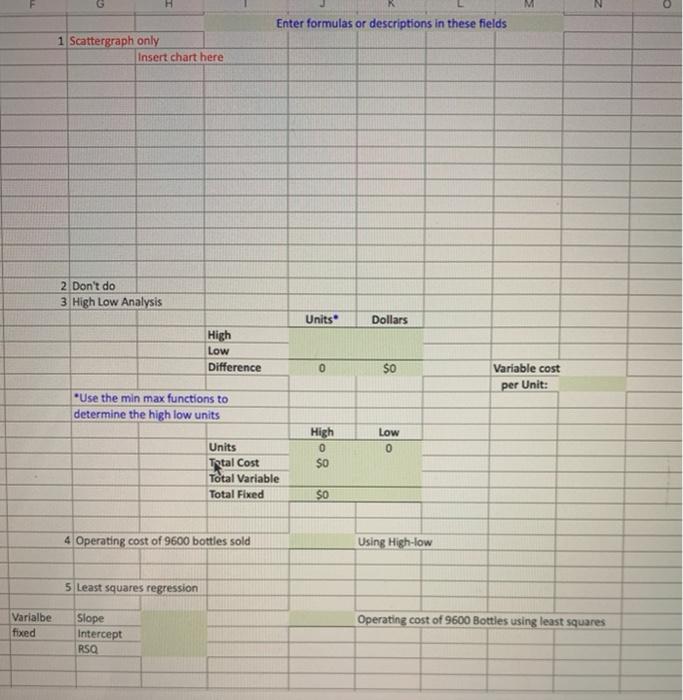
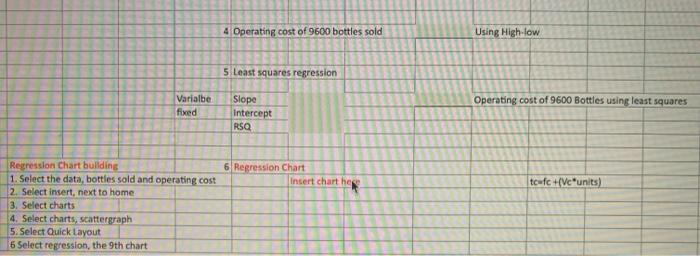
4 5 6 7 8 9 Given Data: 10 11 12 13 14 Month January February March April May June Bottles Sold 1000 1100 1300 2000 2400 3000 Operating Cost $8,000 $7,700 $9,900 $14,000 $17,250 $20,000 15 16 17 18 19 20 21 22 23 o Enter formulas or descriptions in these fields 1 Scattergraph only Insert chart here 2 Don't do 3 High Low Analysis Units Dollars High Low Difference 0 $0 Variable cost per Unit: Use the min max functions to determine the high low units High 0 SO Low 0 Units Total Cost Total Variable Total Fixed $0 4 Operating cost of 9600 bottles sold Using High-low 5 Least squares regression Varialbe fixed Operating cost of 9600 Bottles using least squares Slope Intercept RSQ 4 Operating cost of 9600 bottles sold Using High-low 5 Least squares regression Varialbe fixed Operating cost of 9600 Bottles using least squares Slope Intercept RSQ 6 Regression Chart Insert chart hee tcfc +(Vc units) Regression Chart bullding 1. Select the data, bottles sold and operating cost 2. Select Insert, next to home 3. Select charts 4. Select charts, scattergraph 5. Select Quick Layout 6 Select regression, the 9th chart
Step by Step Solution
There are 3 Steps involved in it

Get step-by-step solutions from verified subject matter experts