

Question: 4. 5. 6. 7. Using the teacher's original grade scale (not your results from question number 2; use the grade scale in boldface print),
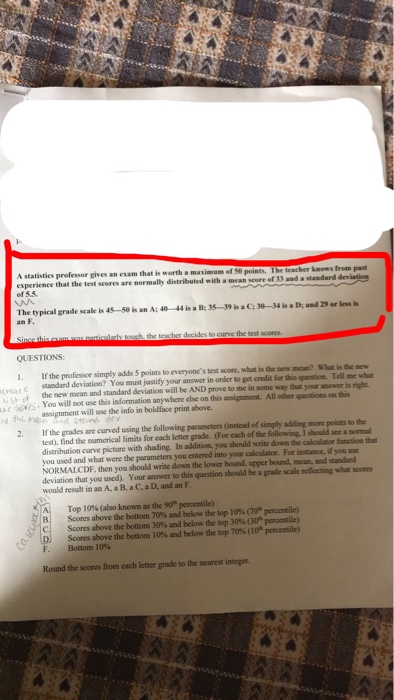
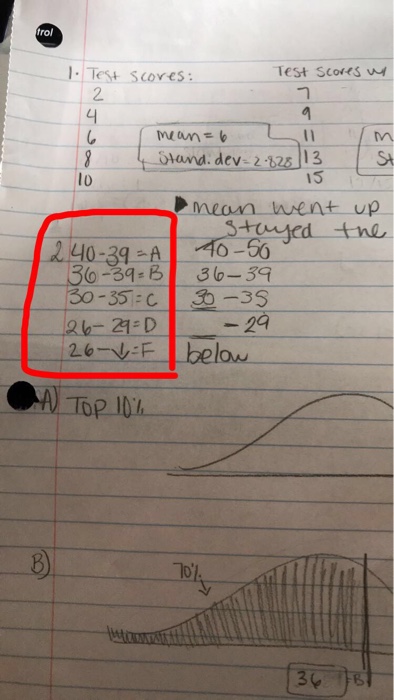
4. 5. 6. 7. Using the teacher's original grade scale (not your results from question number 2; use the grade scale in boldface print), if one student is selected at random, what is the probability that the test score is a 'B' or higher? (I should see a normal distribution with the appropriate area shaded. In addition, tell me what calculator function you used and what parameters you entered into the calculator in order to find your answer and what info you inputted into your calculator). What is the probability of getting 'B' or higher when you select one student at random using the 'new' grade scale from #2? (I should see a normal distribution with the appropriate area shaded. In addition, tell me what calculator function you used and what parameters you entered into the calculator in order to find your answer). Using the original grade scale (boldface grade scale) and selecting 6 students at random, what is the probability that their mean score would be an 'A'? Can the Central Limit Theorem by used in this case even though the sample is small? Why or why not? If you can use the Central Limit Theorem, I need to see the calculation you used to determine the new standard deviation. In addition, tell me what calculator function you used to determine the answer to this question as well as what parameters you entered into your calculator. Do not round your answer. In an attempt to get an estimate of the proportion of his students that generally pass his exam, the statistics professor takes a sample of his data from past classes. He finds that in a sample of 200 test scores, 135 students got a passing grade. He then calculated the following 95% confidence interval estimate based on this sample: 61% < p < 74% (a.) Write the interpretation of this confidence interval (in other words, what does it mean?). (b.) Determine the Margin of Error used in this confidence interval. Show your calculation. ecimal. Places In number 6, the professor used a sample size of 200. Assume that the sample was a simple random sample. Verify that the sample size of 200 was appropriate. Use the value of 135/200=0.675 for the sample proportion of p-hat. Show your calculation. Grading: Question 1: Question 2: Question 3: Question 4: Question 5: 10 total points 25 total points 10 total points 10 total points 15 total points Question 6: 20 total points Question 7: 10 total points -7.2 notes Points are based on completeness, following instructions, accuracy of calculations, and answers to all questions. A statistics professor gives an exam that is worth a maximum of 50 points. The teacher knows from past experience that the test scores are normally distributed with a mean score of 33 and a standard deviation of 5.5. m The typical grade scale is 45-50 is an A; 40-44 is a B; 35-39 is a C; 30-34 is a D; and 29 or less is an F. Since this exam was particularly tough, the teacher decides to curve the test scores. QUESTIONS: 1. If the professor simply adds 5 points to everyone's test score, what is the new mean? What is the new standard deviation? You must justify your answer in order to get credit for this question. Tell me what Cate me in some way that your answer is right. the new mean and standard deviation will be AND prove t list of Spes. You will not use this information anywhere else on this assignment. All other questions on this assignment will use the info in boldface print above. and the main and stound dev 2. If the grades are curved using the following parameters (instead of simply adding more points to the test), find the numerical limits for each letter grade. (For each of the following. I should see a normal distribution curve picture with shading. In addition, you should write down the calculator function that you used and what were the parameters you entered into your calculator. For instance, if you use NORMALCDF, then you should write down the lower bound, upper bound, mean, and standard deviation that you used). Your answer to this question should be a grade scale reflecting what scores would result in an A, a B, a C, a D, and an F. Top 10% (also known as the 90 percentile) Scores above the bottom 70% and below the top 10% (70 Scores above the bottom 30% and below the top 30% (30 Scores above the bottom 10% and below the top 70% (10 Bottom 10% D F. Round the scores from each letter grade to the nearest integer. AA AA percentile) percentile) percentile) trol 1. Test scores: 2 4 6 8 10 240-39-A 36-39-B 30-35 C 26-29=D 126-4F A) TOP 10% mean = 6 11 Stand: dev-2-828 13 15 40-50 36-39 30-35 - 29 Test Scores u below 9 mean went up stayed the 70% St 36
Step by Step Solution
3.38 Rating (151 Votes )
There are 3 Steps involved in it
The following is the original grading scheme A 4550 B 4044 C 3539 D 3334 F 029 The mean would increase by five points if the professor gave each student an extra five points on the exam but the standa... View full answer

Get step-by-step solutions from verified subject matter experts