

Question: 4. 5. 6. 9 Gudrun has created a pie chart representing the percentage of the parks' budget that went to each park in 2018.
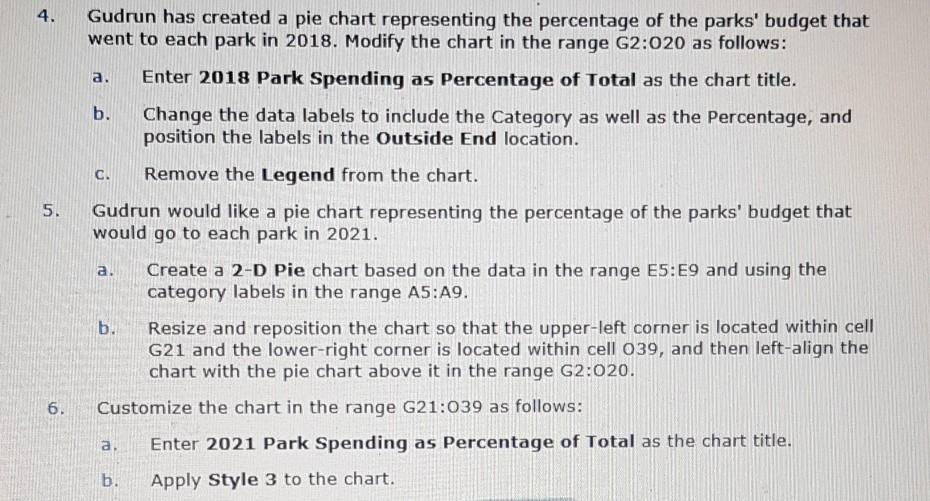
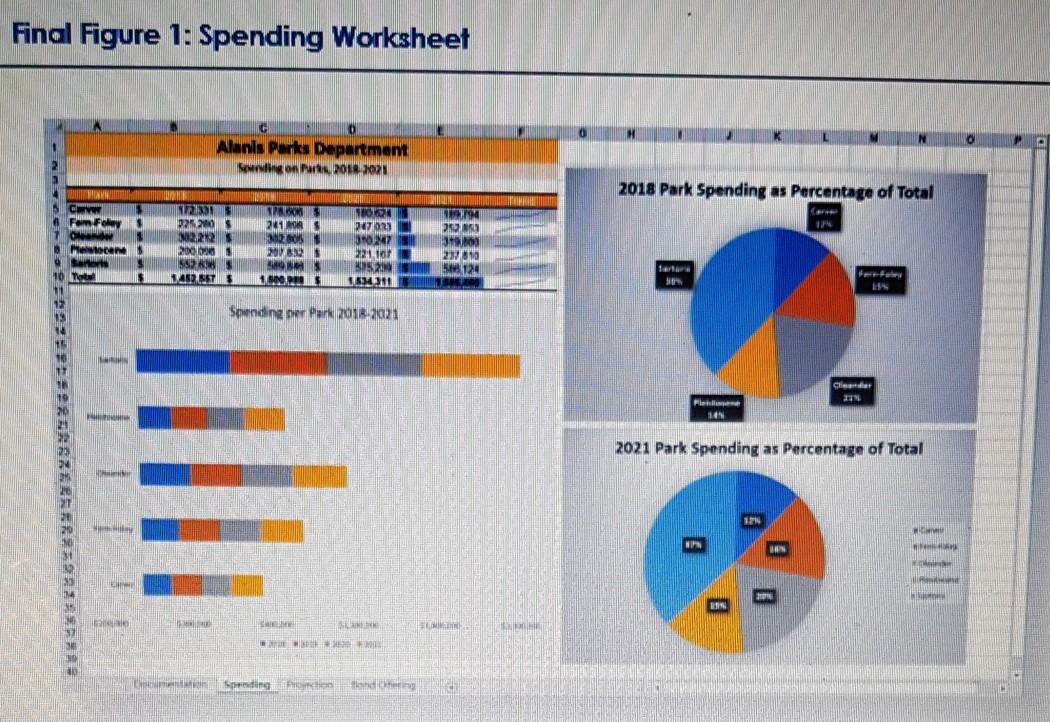
4. 5. 6. 9 Gudrun has created a pie chart representing the percentage of the parks' budget that went to each park in 2018. Modify the chart in the range G2:020 as follows: a. b. Enter 2018 Park Spending as Percentage of Total as the chart title. Change the data labels to include the Category as well as the Percentage, and position the labels in the Outside End location. C. Remove the Legend from the chart. Gudrun would like a pie chart representing the percentage of the parks' budget that would go to each park in 2021. a. b. Create a 2-D Pie chart based on the data in the range E5:E9 and using the category labels in the range A5:A9. Resize and reposition the chart so that the upper-left corner is located within cell G21 and the lower-right corner is located within cell 039, and then left-align the chart with the pie chart above it in the range G2:020. Customize the chart in the range G21:039 as follows: a. Enter 2021 Park Spending as Percentage of Total as the chart title. Apply Style 3 to the chart. b.
Step by Step Solution
There are 3 Steps involved in it

Get step-by-step solutions from verified subject matter experts