

Question: 4. (a) Caleulate the Economic Order Quantity (EOQ) for the following data. Annual demans Ordering cost Inventory carrying cost 20% of cost per unit Costperunit=$18forlotsize149=$17.75forlotsize5099=$17.5forlotsize100149=$17.25forlotsize150199=$17forlotsize200up
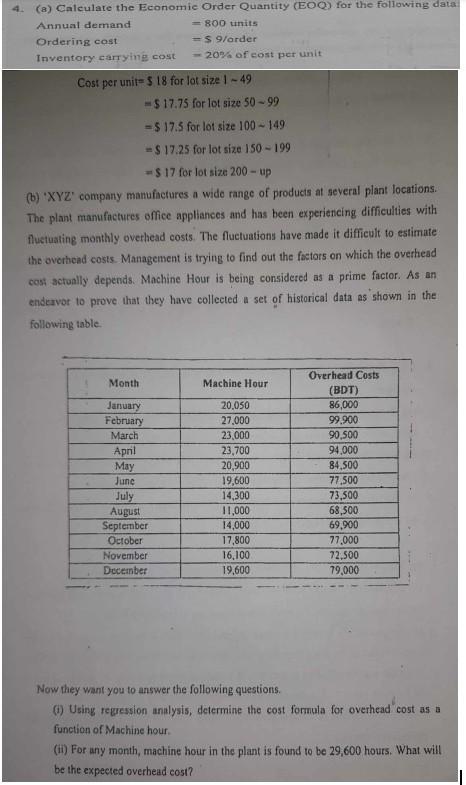
4. (a) Caleulate the Economic Order Quantity (EOQ) for the following data. Annual demans Ordering cost Inventory carrying cost 20% of cost per unit Costperunit=$18forlotsize149=$17.75forlotsize5099=$17.5forlotsize100149=$17.25forlotsize150199=$17forlotsize200up (b) 'XYZ' company manufictures a wide range of products at several plant locations. The plant manufactures office appliances and has been experiencing difficulties with fluetuating monthly overhead costs. The fluctuations have made it difficult to estimate the overhead costs. Management is trying to find out the fastors on which the overhead cost actually depends. Machine Hour is being consideted as a prime factor. As an endeavor to prove that they have collected a set of historical data as shown in the following table. Now they want you to answer the following questions. (i) Using regression analysis, determine the cost formula for overhead cost as a function of Machine hour. (ii) For any month, machine hour in the plant is found to be 29,600 hours. What will be the expected overhead cost
Step by Step Solution
There are 3 Steps involved in it

Get step-by-step solutions from verified subject matter experts