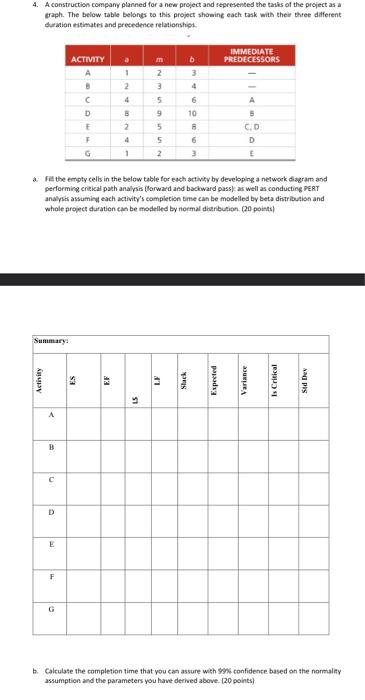
Question: 4. A construction company planned for a new project and represented the tasks of the project as a graph. The below table belongs to this

4. A construction company planned for a new
4. A construction company planned for a new project and represented the tasks of the project as a graph. The below table belongs to this project showing each task with their three different duration estimates and precedence relationships ACTIVITY IMMEDIATE PREDECESSORS m b A 1 2 2 3 4 5 A D B 5 E 2 5 8 C.D F 5 6 D G 1 2 3 E a. Fill the empty cells in the below table for each activity by developing a network diagram and performing critical path analysis (forward and backward pass) as well as conducting PERT analysis assuming each activity's completion time can be modelled by beta distribution and whole project duration can be modelled by normal distribution. (20 points) Summary: Activity ES EF A B D E the 4 LS 9 LF 3 4 6 10 F G b. Calculate the completion time that you can assure with 99% confidence based on the normality assumption and the parameters you have derived above. (20 points)

Step by Step Solution

There are 3 Steps involved in it

1 Expert Approved Answer
Step: 1 Unlock blur-text-image
Question Has Been Solved by an Expert!

Get step-by-step solutions from verified subject matter experts

Step: 2 Unlock
Step: 3 Unlock

Students Have Also Explored These Related General Management Questions!