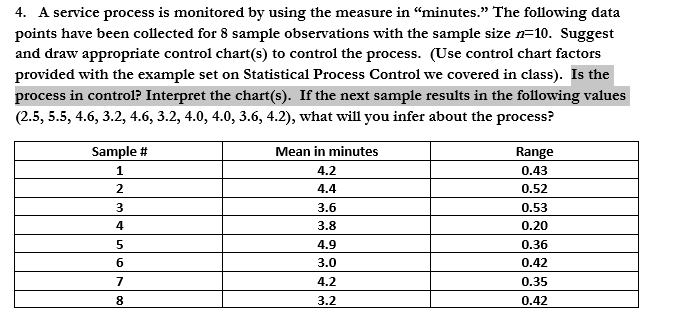
Question: 4. A service process is monitored by using the measure in minutes. The following data points have been collected for 8 sample observations with the

4. A service process is monitored by using the

4. A service process is monitored by using the measure in "minutes. The following data points have been collected for 8 sample observations with the sample size n=10. Suggest and draw appropriate control chart(s) to control the process. (Use control chart factors provided with the example set on Statistical Process Control we covered in class). Is the process in control? Interpret the chart(s). If the next sample results in the following values (2.5, 5.5, 4.6, 3.2, 4.6, 3.2, 4.0, 4.0, 3.6, 4.2), what will you infer about the process? Sample # 1 2 Range 0.43 0.52 Mean in minutes 4.2 4.4 3.6 3.8 4.9 3.0 3 4 5 6 7 0.53 0.20 0.36 0.42 0.35 0.42 4.2 8 3.2

Step by Step Solution

There are 3 Steps involved in it

1 Expert Approved Answer
Step: 1 Unlock blur-text-image
Question Has Been Solved by an Expert!

Get step-by-step solutions from verified subject matter experts

Step: 2 Unlock
Step: 3 Unlock

Students Have Also Explored These Related General Management Questions!