

Question: 4. After calculating and adding the control limits to your plot, it has now become a control chart! The control chart for Response Time is
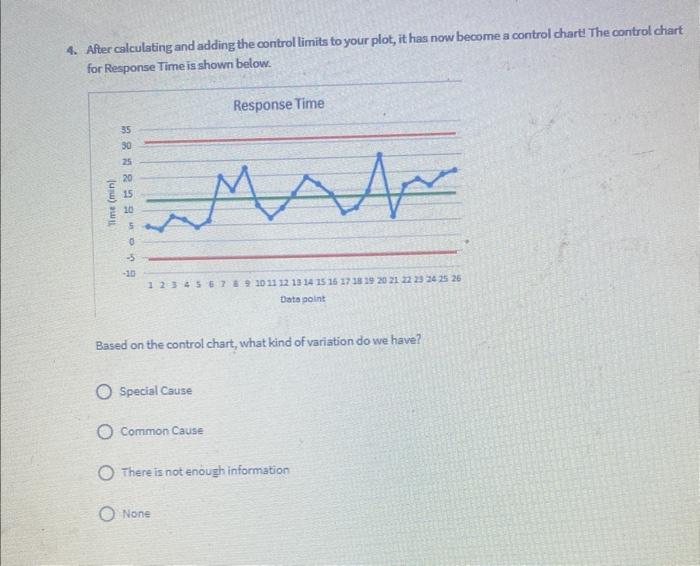
4. After calculating and adding the control limits to your plot, it has now become a control chart! The control chart for Response Time is shown below. Based on the control chart, what kind of variation do we have? Special Cause Common Cause There is not enough information None
Step by Step Solution
There are 3 Steps involved in it
1 Expert Approved Answer
Step: 1 Unlock

Question Has Been Solved by an Expert!
Get step-by-step solutions from verified subject matter experts
Step: 2 Unlock
Step: 3 Unlock