

Question: 4. Analyze contribution margin by using a pivot table. 5. Analyze contribution margin ratio by using a pivot table. Sort the collections by contribution margin
4. Analyze contribution margin by using a pivot table.
5. Analyze contribution margin ratio by using a pivot table. Sort the collections by contribution margin ratio, from the largest to the smallest.
6. Analyze segment margin and operating income for 2018 using the table provided.
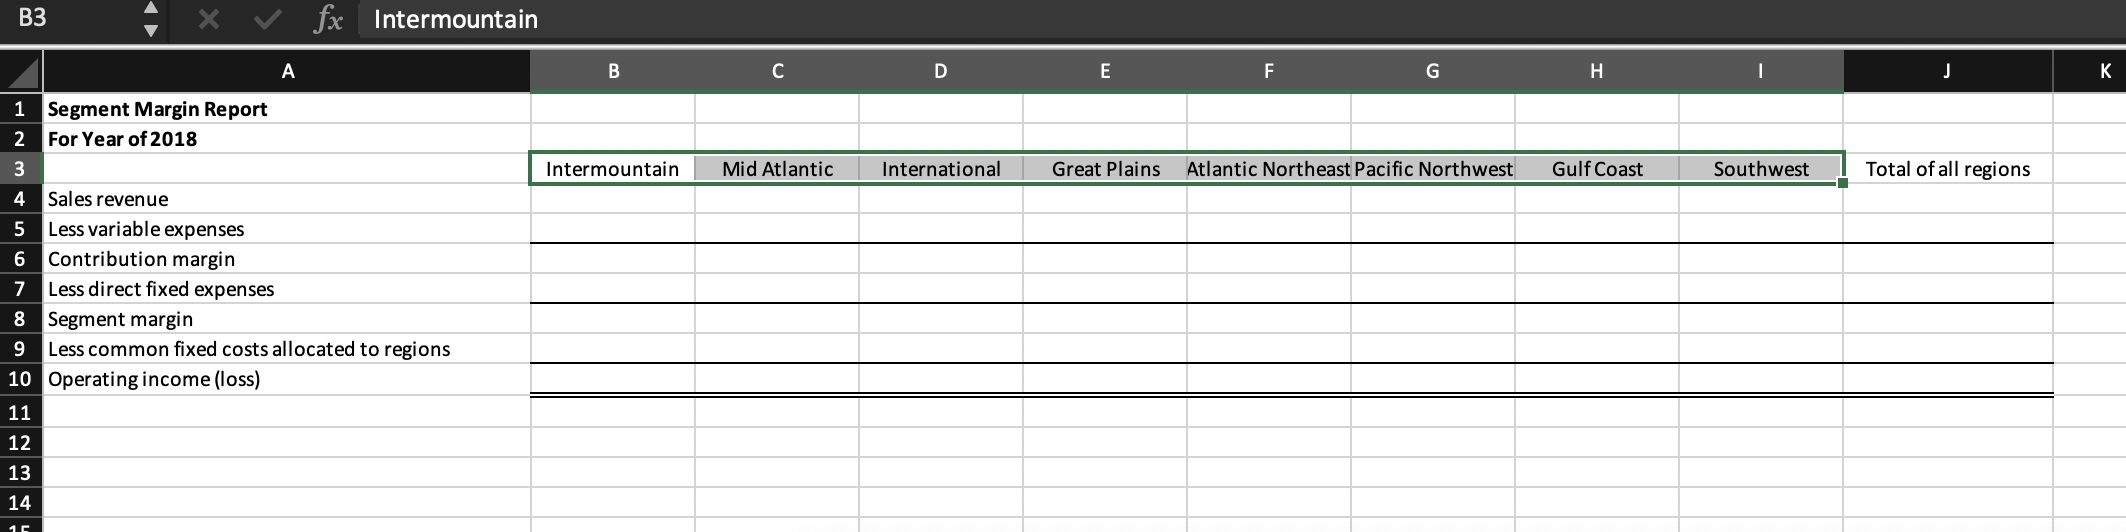
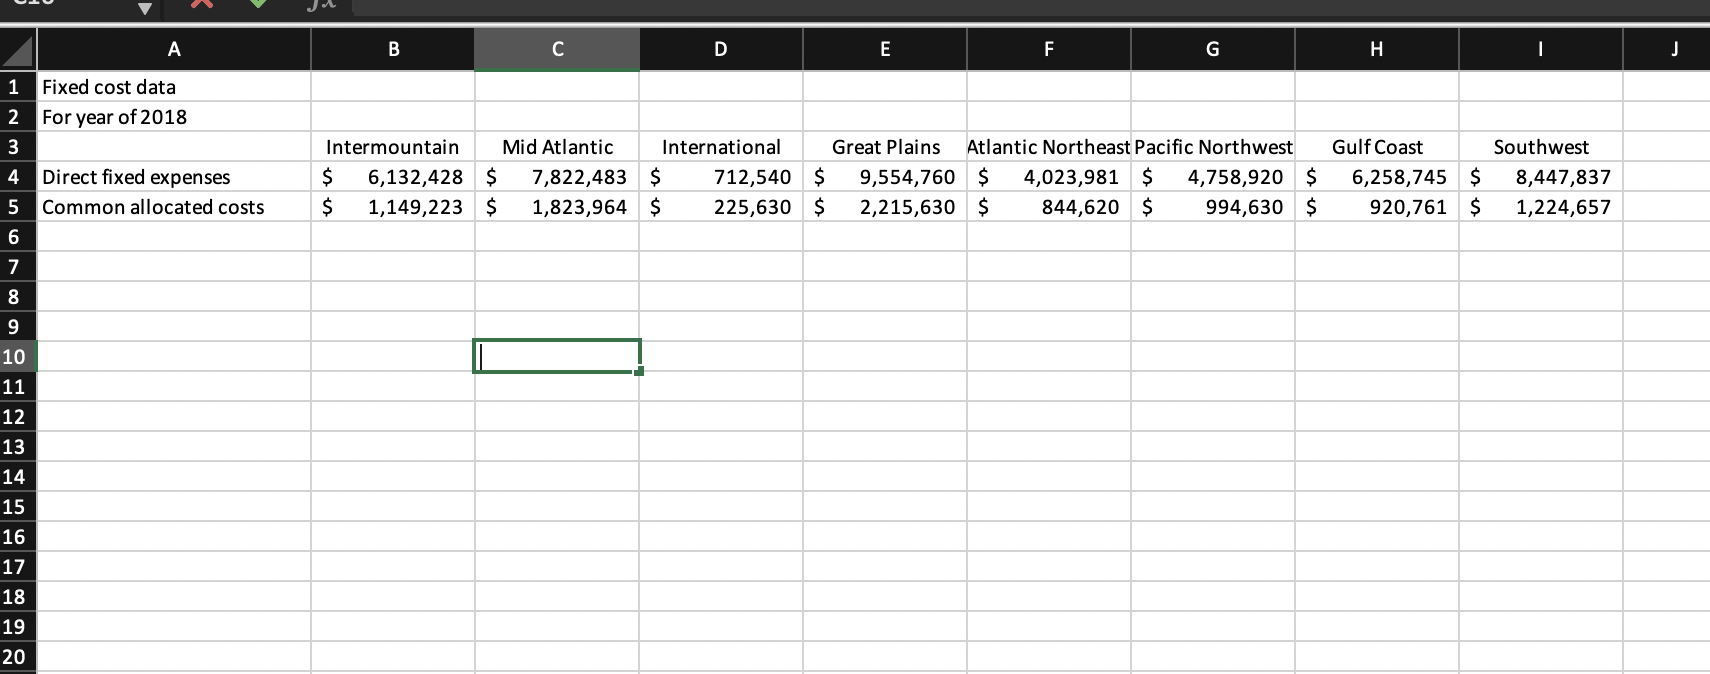
B3 fx Intermountain A B C D E F H J K Intermountain Mid Atlantic International Great Plains Atlantic Northeast Pacific Northwest Gulf Coast Southwest Total of all regions 1 Segment Margin Report 2 For Year of 2018 3 4 Sales revenue 5 Less variable expenses 6 Contribution margin 7 Less direct fixed expenses 8 Segment margin 9 Less common fixed costs allocated to regions 10 Operating income (loss) 11 12 13 14 15 A B C D E F G H J 1 Fixed cost data 2 For year of 2018 3 4. Direct fixed expenses 5 Common allocated costs Intermountain Mid Atlantic International Great Plains Atlantic Northeast Pacific Northwest $ 6,132,428 $ 7,822,483 $ 712,540 $ 9,554,760 $ 4,023,981 $ 4,758,920 $ $ 1,149,223 $ 1,823,964 $ 225,630 $ 2,215,630 $ 844,620 $ 994,630 $ Gulf Coast 6,258,745 $ 920,761 $ Southwest 8,447,837 1,224,657 6 7 8 9 10 11 12 13 14 15 16 17 18 19 20 B3 fx Intermountain A B C D E F H J K Intermountain Mid Atlantic International Great Plains Atlantic Northeast Pacific Northwest Gulf Coast Southwest Total of all regions 1 Segment Margin Report 2 For Year of 2018 3 4 Sales revenue 5 Less variable expenses 6 Contribution margin 7 Less direct fixed expenses 8 Segment margin 9 Less common fixed costs allocated to regions 10 Operating income (loss) 11 12 13 14 15 A B C D E F G H J 1 Fixed cost data 2 For year of 2018 3 4. Direct fixed expenses 5 Common allocated costs Intermountain Mid Atlantic International Great Plains Atlantic Northeast Pacific Northwest $ 6,132,428 $ 7,822,483 $ 712,540 $ 9,554,760 $ 4,023,981 $ 4,758,920 $ $ 1,149,223 $ 1,823,964 $ 225,630 $ 2,215,630 $ 844,620 $ 994,630 $ Gulf Coast 6,258,745 $ 920,761 $ Southwest 8,447,837 1,224,657 6 7 8 9 10 11 12 13 14 15 16 17 18 19 20
Step by Step Solution
There are 3 Steps involved in it

Get step-by-step solutions from verified subject matter experts