

Question: 4. Analyze level, trend, and variability of data in each condition for each participant. NOTE: You should be looking at each individual phase and should
4. Analyze level, trend, and variability of data in each condition for each participant. NOTE: You should be looking at each individual phase and should not be comparing data across phases at this point. Determine if there are clear data patterns within all conditions. Explain your findings.
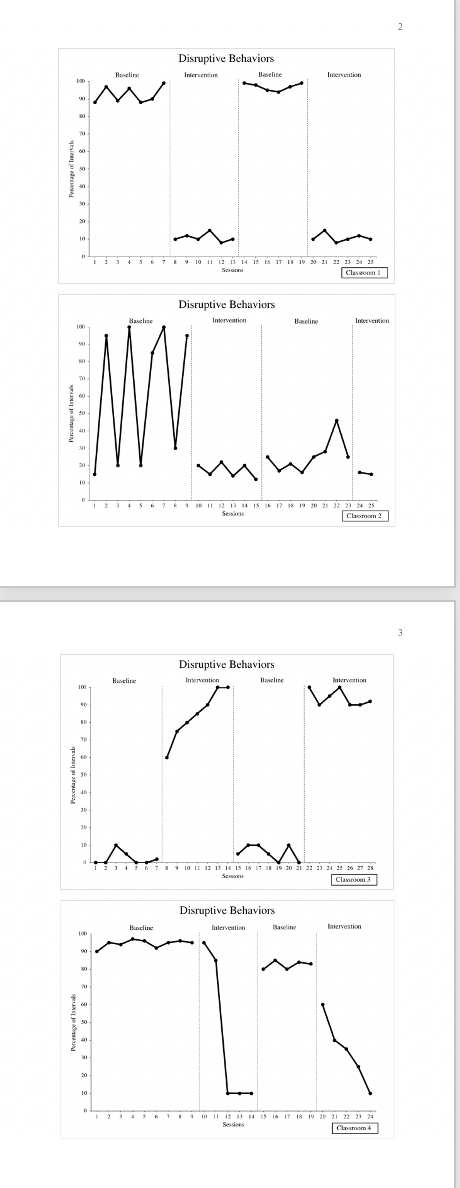
Disruptive Behaviors Intervention Baseline Intervention Percentage of Imerval 10 11 12 13 14 13 15 17 18 19 23 21 22 23 24 19 Sexdom Classpoten I Disruptive Behaviors Baseling Intervention Baseline Intervention 190 Percentage of Intervals 10 3 4 5 6 7 8 9 80 11 12 13 84 15 06 17 18 19 20 21 22 23 24 25 Sessions Closmom 2 Disruptive Behaviors Hoccling Imervention Baseline Intervention 10 Texantage of Intervals 10 11 12 13 14 15 16 13 18 19 30 21 22 23 24 29 26 27 28 Classroom 3 Disruptive Behaviors Banclin Intervention Blascling Intervention Percentage of Invervals 50 10 11 12 83 84 15 16 17 18 19 20 21 22 23 24 Cleamom 4
Step by Step Solution
There are 3 Steps involved in it

Get step-by-step solutions from verified subject matter experts