

Question: 4. Are the probability data given in Table 2-1a consistent with the time series data given in table 2-1b? If the securities' expected values and
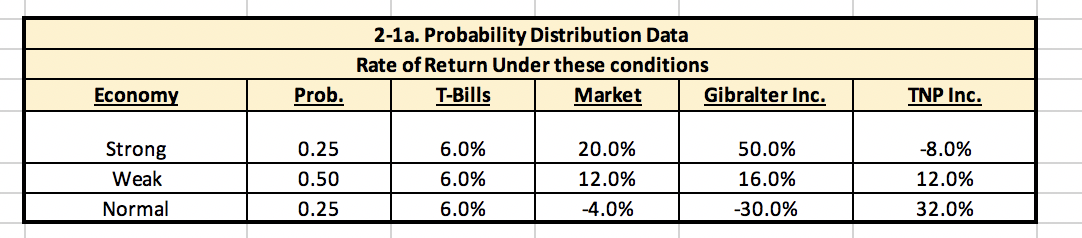
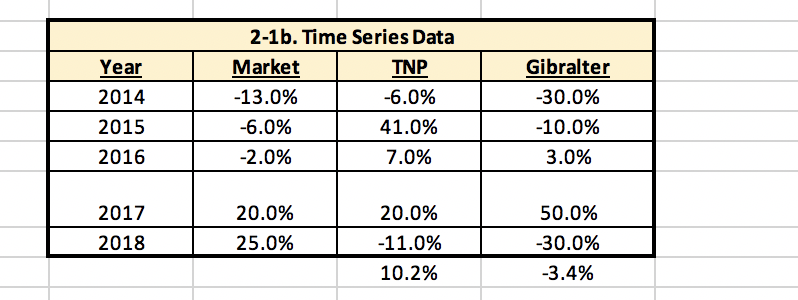
4. Are the probability data given in Table 2-1a consistent with the time series data given in table 2-1b? If the securities' expected values and standard deviations as shown in the two sets of data are different, does this prove that something is wrong with the data, i.e., that one or the other data sets must be incorrect? 2-1a. Probability Distribution Data Rate of Return Under these conditions T-Bills Market Gibralter Inc. Economy Prob. TNP Inc. 0.25 -8.0% Strong Weak Normal 0.50 6.0% 6.0% 6.0% 20.0% 12.0% -4.0% 50.0% 16.0% -30.0% 12.0% 32.0% 0.25 Year 2014 2015 2016 2-1b. Time Series Data Market TNP -13.0% -6.0% -6.0% 41.0% -2.0% 7.0% Gibralter -30.0% -10.0% 3.0% 20.0% 50.0% 2017 2018 25.0% 20.0% -11.0% 10.2% -30.0% -3.4% 4. Are the probability data given in Table 2-1a consistent with the time series data given in table 2-1b? If the securities' expected values and standard deviations as shown in the two sets of data are different, does this prove that something is wrong with the data, i.e., that one or the other data sets must be incorrect? 2-1a. Probability Distribution Data Rate of Return Under these conditions T-Bills Market Gibralter Inc. Economy Prob. TNP Inc. 0.25 -8.0% Strong Weak Normal 0.50 6.0% 6.0% 6.0% 20.0% 12.0% -4.0% 50.0% 16.0% -30.0% 12.0% 32.0% 0.25 Year 2014 2015 2016 2-1b. Time Series Data Market TNP -13.0% -6.0% -6.0% 41.0% -2.0% 7.0% Gibralter -30.0% -10.0% 3.0% 20.0% 50.0% 2017 2018 25.0% 20.0% -11.0% 10.2% -30.0% -3.4%
Step by Step Solution
There are 3 Steps involved in it

Get step-by-step solutions from verified subject matter experts