

Question: 4 . Assuming that revenues will be allocated 80-20 based on SCHs and the number of majors, recalculate the new RCM budgets for each college,
4. Assuming that revenues will be allocated 80-20 based on SCHs and the number of majors, recalculate the new RCM budgets for each college, using activity-based costing. Which colleges would see an increase (decrease) in their budget?
5. How might the new RCM budget, using activity-based costing mentioned in Question 4, impact the colleges behaviorsnoting that declaring majors differ among the colleges?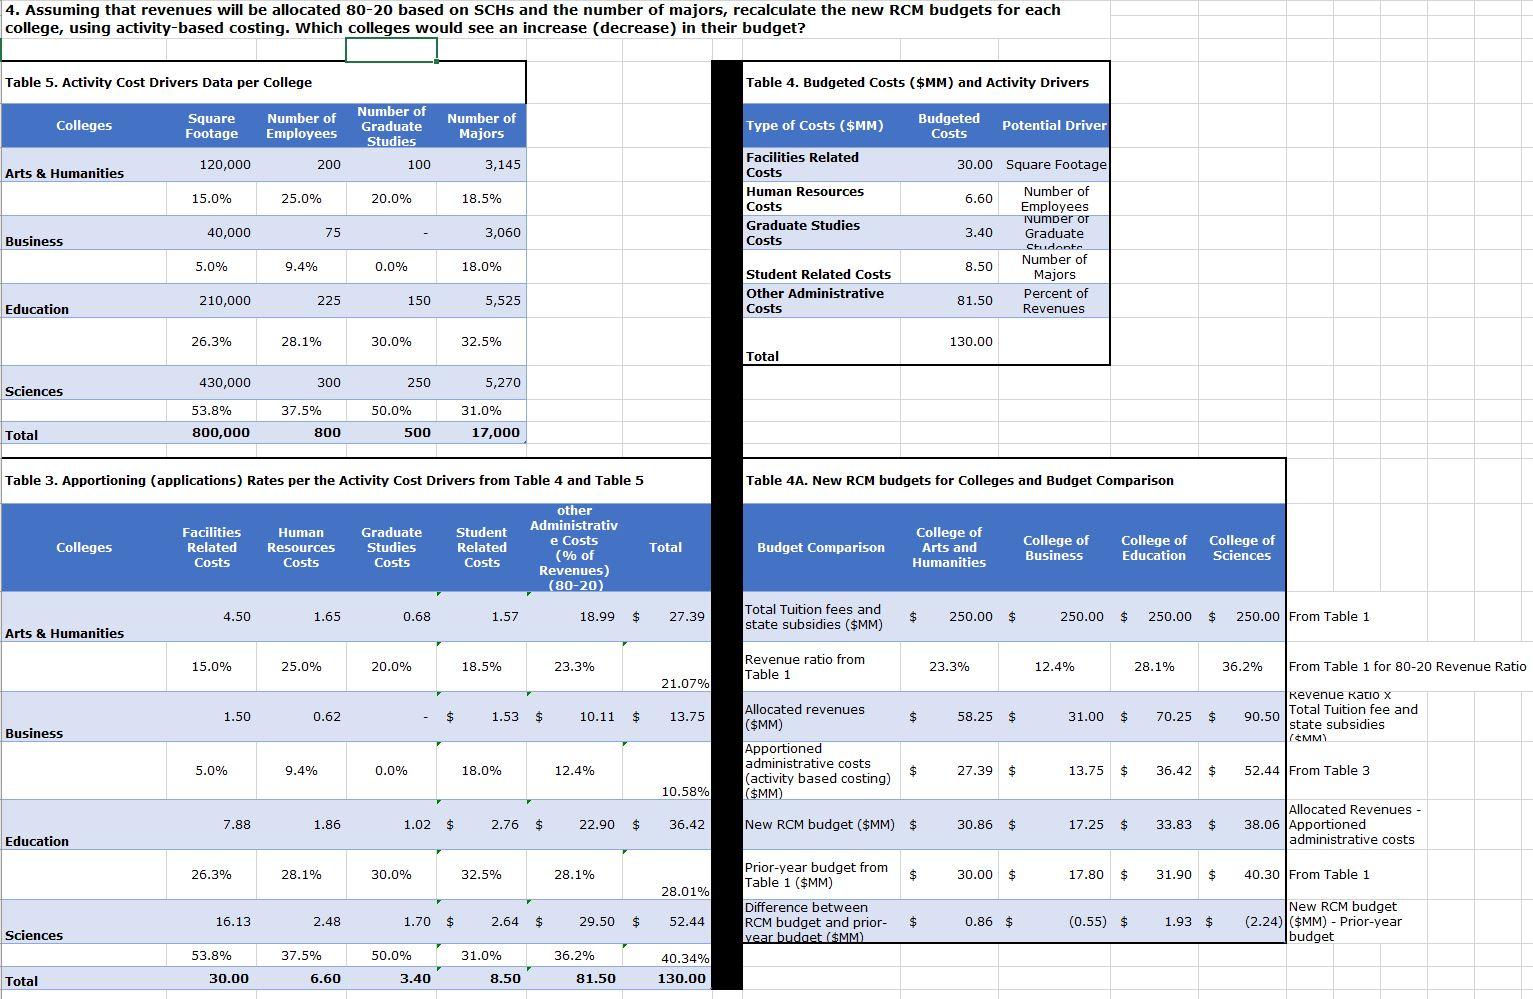
4. Assuming that revenues will be allocated 80-20 based on SCHs and the number of majors, recalculate the new RCM budgets for each college, using activity-based costing. Which colleges would see an increase (decrease) in their budget? Table 5. Activity Cost Drivers Data per College Table 4. Budgeted Costs ($MM) and Activity Drivers Colleges Square Footage Number of Employees Number of Graduate Studies Number of Majors Type of Costs ($MM) Budgeted Costs Potential Driver 120,000 200 100 3,145 Arts & Humanities 30.00 Square Footage 15.0% 25.0% 20.0% 18.5% Facilities Related Costs Human Resources Costs Graduate Studies Costs 6.60 40,000 75 3,060 3.40 Business Number of Employees Number or Graduate Studente Number of Majors Percent of Revenues 5.0% 9.4% 0.0% 18.0% 8.50 Student Related Costs Other Administrative Costs 210,000 225 150 5,525 81.50 Education 26.3% 28.1% 30.0% 32.5% 130.00 Total 430,000 300 250 Sciences 5,270 53.8% 37.5% 800 50.0% 500 31.0% 17,000 Total 800,000 Table 3. Apportioning (applications) Rates per the Activity Cost Drivers from Table 4 and Table 5 Table 4A. New RCM budgets for Colleges and Budget Comparison Colleges Facilities Related Costs Human Resources Costs Graduate Studies Costs Student Related Costs other Administrativ e Costs (% of Revenues) (80-20) Total Budget Comparison College of Arts and Humanities College of Business College of Education College of Sciences 4.50 1.65 0.68 1.57 18.99 $ 27.39 Total Tuition fees and state subsidies ($MM) 250.00 $ 250.00 $ 250.00 $ 250.00 From Table 1 Arts & Humanities 15.0% 25.0% 20.0% 18.5% 23.3% Revenue ratio from Table 1 23.3% 12.4% 28.1% 36.2% From Table 1 for 80-20 Revenue Ratio 21.07% 1.50 0.62 $ 1.53 $ 10.11 $ 13.75 58.25 $ 31.00 $ 70.25 $ Revenue Ratio x 90.50 Total Tuition fee and state subsidies (MM) Business Allocated revenues ($MM) Apportioned administrative costs (activity based costing) ($MM) 5.0% 9.4% 0.0% 18.0% 12.4% 27.39 $ 13.75 $ 36.42 $ 52.44 From Table 3 10.58% 7.88 1.86 1.02 $ 2.76 $ 22.90 $ 36.42 New RCM budget ($MM) $ 30.86 $ 17.25 $ 33.83 $ Allocated Revenues - 38.06 Apportioned administrative costs Education 26.3% 28 30.0 82.59 30.00 $ 17.80 $ 31.90 $ 40.30 From Table 1 28.01% Prior-year budget from Table 1 ($MM) Difference between RCM budget and prior- vear budget (SMM) 16.13 2.48 1.70 $ 2.64 $ 29.50 $ 52.44 0.86 $ (0.55) $ 1.93 $ New RCM budget (2.24) ($MM) - Prior-year budget Sciences 53.8% 50.0% 36.2% 37.5% 6.60 31.0% 8.50 40.34% 130.00 Total 30.00 3.40 81.50 4. Assuming that revenues will be allocated 80-20 based on SCHs and the number of majors, recalculate the new RCM budgets for each college, using activity-based costing. Which colleges would see an increase (decrease) in their budget? Table 5. Activity Cost Drivers Data per College Table 4. Budgeted Costs ($MM) and Activity Drivers Colleges Square Footage Number of Employees Number of Graduate Studies Number of Majors Type of Costs ($MM) Budgeted Costs Potential Driver 120,000 200 100 3,145 Arts & Humanities 30.00 Square Footage 15.0% 25.0% 20.0% 18.5% Facilities Related Costs Human Resources Costs Graduate Studies Costs 6.60 40,000 75 3,060 3.40 Business Number of Employees Number or Graduate Studente Number of Majors Percent of Revenues 5.0% 9.4% 0.0% 18.0% 8.50 Student Related Costs Other Administrative Costs 210,000 225 150 5,525 81.50 Education 26.3% 28.1% 30.0% 32.5% 130.00 Total 430,000 300 250 Sciences 5,270 53.8% 37.5% 800 50.0% 500 31.0% 17,000 Total 800,000 Table 3. Apportioning (applications) Rates per the Activity Cost Drivers from Table 4 and Table 5 Table 4A. New RCM budgets for Colleges and Budget Comparison Colleges Facilities Related Costs Human Resources Costs Graduate Studies Costs Student Related Costs other Administrativ e Costs (% of Revenues) (80-20) Total Budget Comparison College of Arts and Humanities College of Business College of Education College of Sciences 4.50 1.65 0.68 1.57 18.99 $ 27.39 Total Tuition fees and state subsidies ($MM) 250.00 $ 250.00 $ 250.00 $ 250.00 From Table 1 Arts & Humanities 15.0% 25.0% 20.0% 18.5% 23.3% Revenue ratio from Table 1 23.3% 12.4% 28.1% 36.2% From Table 1 for 80-20 Revenue Ratio 21.07% 1.50 0.62 $ 1.53 $ 10.11 $ 13.75 58.25 $ 31.00 $ 70.25 $ Revenue Ratio x 90.50 Total Tuition fee and state subsidies (MM) Business Allocated revenues ($MM) Apportioned administrative costs (activity based costing) ($MM) 5.0% 9.4% 0.0% 18.0% 12.4% 27.39 $ 13.75 $ 36.42 $ 52.44 From Table 3 10.58% 7.88 1.86 1.02 $ 2.76 $ 22.90 $ 36.42 New RCM budget ($MM) $ 30.86 $ 17.25 $ 33.83 $ Allocated Revenues - 38.06 Apportioned administrative costs Education 26.3% 28 30.0 82.59 30.00 $ 17.80 $ 31.90 $ 40.30 From Table 1 28.01% Prior-year budget from Table 1 ($MM) Difference between RCM budget and prior- vear budget (SMM) 16.13 2.48 1.70 $ 2.64 $ 29.50 $ 52.44 0.86 $ (0.55) $ 1.93 $ New RCM budget (2.24) ($MM) - Prior-year budget Sciences 53.8% 50.0% 36.2% 37.5% 6.60 31.0% 8.50 40.34% 130.00 Total 30.00 3.40 81.50
Step by Step Solution
There are 3 Steps involved in it

Get step-by-step solutions from verified subject matter experts