

Question: 4. BAC vs. Wine consumption The data set from the University of Western Sydney in Sydney, Australia BAC and wine consumption study is given in
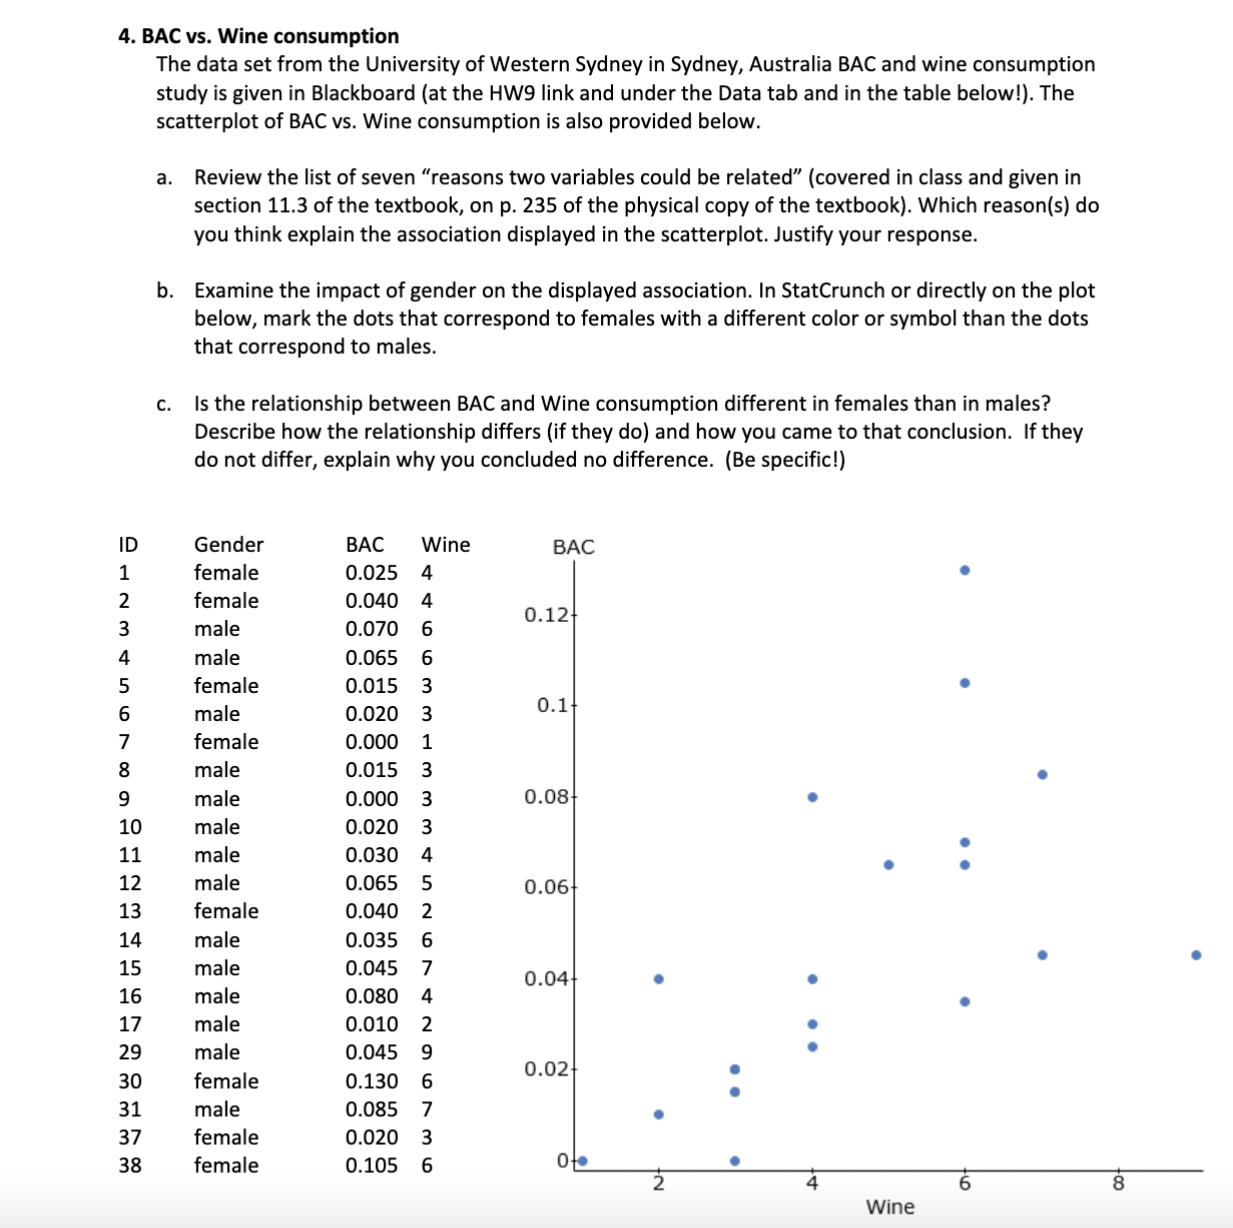
4. BAC vs. Wine consumption The data set from the University of Western Sydney in Sydney, Australia BAC and wine consumption study is given in Blackboard (at the HWQ link and under the Data tab and in the table below\". The scatterplot of BAC vs. Wine consumption is also provided below. LDOOMO'HU'l-b-UJNi'E WWWWNHHHHHHHH ooupotoummhwhaido a. Review the list of seven "reasons two variables could be related\" (covered in class and given in section 11.3 of the textbook, on p. 235 of the physical copy of the textbook}. Which reason(s) do you think explain the association displayed in the scatterplot. Justify your response. Examine the impact of gender on the displayed association. In StatCrunch or directly on the plot below, mark the dots that correspond to females with a different color or symbol than the dots that correspond to males. Is the relationship between BAC and Wine consumption different in females than in males? Describe how the relationship differs (if they do) and how you came to that conclusion. If they do not differ, explain why you concluded no difference. (Be specific!) Gender BAC Wine BAC female 0.025 4 female 0.040 4 male 0.070 6 0'12 male 0.065 6 female 0.015 3 male 0.020 3 0'1 female 0.000 1 male 0.015 3 male 0.000 3 0.08 male 0.020 3 male 0.030 4 male 0.065 5 o_05 female 0.040 2 male 0.035 6 male 0.045 7 0.04 male 0.080 4 male 0.010 2 male 0.045 9 female 0.130 6 0'02 male 0.085 7 female 0.020 3 female 0.105 6 0 Wine
Step by Step Solution
There are 3 Steps involved in it

Get step-by-step solutions from verified subject matter experts