

Question: 4. Below is a table containing COVID-19 vaccination data for Sonoma County. Day O was the last day that no individuals in Sonoma County had
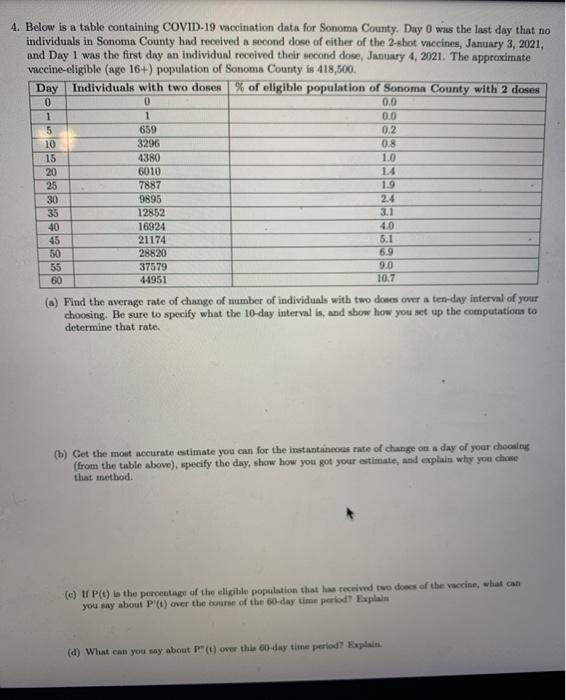
4. Below is a table containing COVID-19 vaccination data for Sonoma County. Day O was the last day that no individuals in Sonoma County had received a second dose of either of the 2-shot vaccines, January 3, 2021, and Day I was the first day an individual received their second dose, January 4, 2021. The approximate vaccine-eligible (age 16+) population of Sonoma County is 418,500, Day Individuals with two doses % of eligible population of Sonoma County with 2 doses 0 0 0.0 1 1 0.0 5 659 0.2 10 3296 0.8 15 4380 1.0 20 6010 1.4 25 7887 1.9 30 9895 2.4 35 12852 3.1 40 16924 4.0 45 21174 5.1 50 28820 6.9 55 37579 9.0 60 44951 (a) Find the average rate of change of number of individuals with two dones over a ten-day interval of your choosing. Be sure to specify what the 10-day interval is, and show how you set up the computations to determine that rate. 10.7 (b) Get the most accurate estimate you can for the instantaneous rate of change on a day of your choosing (from the table above), specify the day, show how you got your estimate, and explain why you chose that method. (c) IP(t) te the percentage of the eligible population that has received two doors of the vaccine, what can you may about P'(t) over the course of the 60-day time period Explain (d) What can you say about PT() over this 60 day time periodExplain. 4. Below is a table containing COVID-19 vaccination data for Sonoma County. Day O was the last day that no individuals in Sonoma County had received a second dose of either of the 2-shot vaccines, January 3, 2021, and Day I was the first day an individual received their second dose, January 4, 2021. The approximate vaccine-eligible (age 16+) population of Sonoma County is 418,500, Day Individuals with two doses % of eligible population of Sonoma County with 2 doses 0 0 0.0 1 1 0.0 5 659 0.2 10 3296 0.8 15 4380 1.0 20 6010 1.4 25 7887 1.9 30 9895 2.4 35 12852 3.1 40 16924 4.0 45 21174 5.1 50 28820 6.9 55 37579 9.0 60 44951 (a) Find the average rate of change of number of individuals with two dones over a ten-day interval of your choosing. Be sure to specify what the 10-day interval is, and show how you set up the computations to determine that rate. 10.7 (b) Get the most accurate estimate you can for the instantaneous rate of change on a day of your choosing (from the table above), specify the day, show how you got your estimate, and explain why you chose that method. (c) IP(t) te the percentage of the eligible population that has received two doors of the vaccine, what can you may about P'(t) over the course of the 60-day time period Explain (d) What can you say about PT() over this 60 day time periodExplain
Step by Step Solution
There are 3 Steps involved in it

Get step-by-step solutions from verified subject matter experts