

Question: 4. Break-even analysis is helpful for location decision making as well as other applications. Suppose your company is considering building a production facility in one
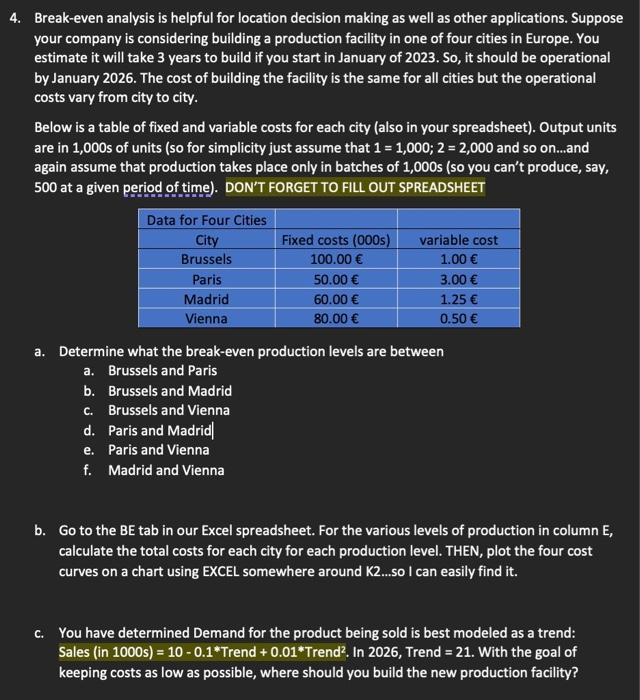
4. Break-even analysis is helpful for location decision making as well as other applications. Suppose your company is considering building a production facility in one of four cities in Europe. You estimate it will take 3 years to build if you start in January of 2023. So, it should be operational by January 2026. The cost of building the facility is the same for all cities but the operational costs vary from city to city. Below is a table of fixed and variable costs for each city (also in your spreadsheet). Output units are in 1,000 s of units (so for simplicity just assume that 1=1,000;2=2,000 and so on...and again assume that production takes place only in batches of 1,000s (so you can't produce, say, 500 at a given period of time). DON'T FORGET TO FILL OUT SPREADSHEET a. Determine what the break-even production levels are between a. Brussels and Paris b. Brussels and Madrid c. Brussels and Vienna d. Paris and Madrid| e. Paris and Vienna f. Madrid and Vienna b. Go to the BE tab in our Excel spreadsheet. For the various levels of production in column E, calculate the total costs for each city for each production level. THEN, plot the four cost curves on a chart using EXCEL somewhere around K2...so I can easily find it. c. You have determined Demand for the product being sold is best modeled as a trend: Sales (in 1000s) =100.1 Trend +0.01 Trend 2. In 2026, Trend =21. With the goal of keeping costs as low as possible, where should you build the new production facility
Step by Step Solution
There are 3 Steps involved in it

Get step-by-step solutions from verified subject matter experts