

Question: (4) Consider the data on demographic characteristics from two separate samples in Tablel. Make an educated guess: in what sample was treatment randomly assigned
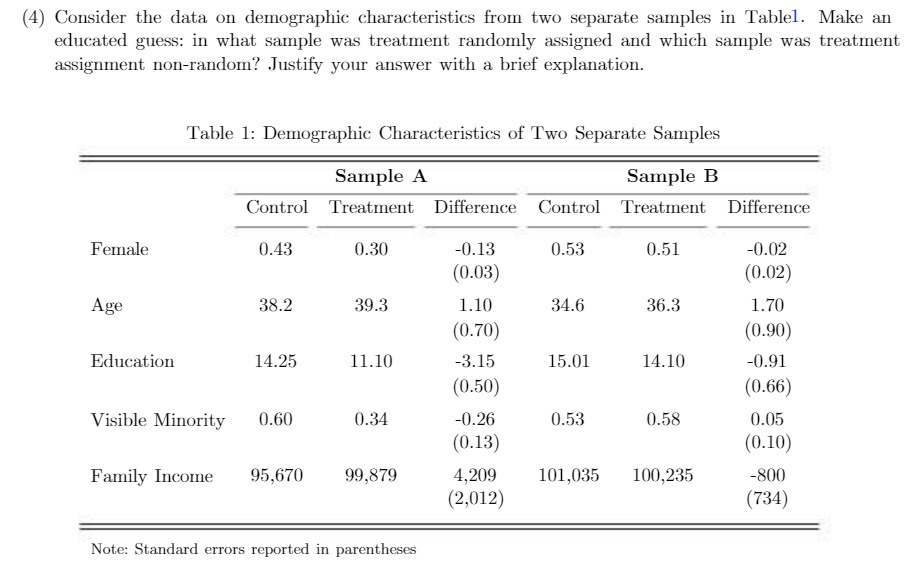
(4) Consider the data on demographic characteristics from two separate samples in Tablel. Make an educated guess: in what sample was treatment randomly assigned and which sample was treatment assignment non-random? Justify your answer with a brief explanation. Female Age Education Table 1: Demographic Characteristics of Two Separate Samples Sample A Sample B Control Treatment Difference Control Treatment Difference 0.43 Family Income 38.2 14.25 Visible Minority 0.60 0.30 39.3 11.10 0.34 95,670 99,879 Note: Standard errors reported in parentheses -0.13 (0.03) 1.10 (0.70) -3.15 (0.50) -0.26 (0.13) 4,209 (2,012) 0.53 34.6 15.01 0.53 0.51 36.3 14.10 0.58 101,035 100,235 -0.02 (0.02) 1.70 (0.90) -0.91 (0.66) 0.05 (0.10) -800 (734)
Step by Step Solution
There are 3 Steps involved in it
To determine which sample had treatment randomly assigned and which sample had nonrandom treatment a... View full answer

Get step-by-step solutions from verified subject matter experts