

Question: 4. Consider the samples in vials 2,3 , and 4. Judging by the appearance of your boiling point curve, which sample appears to be most
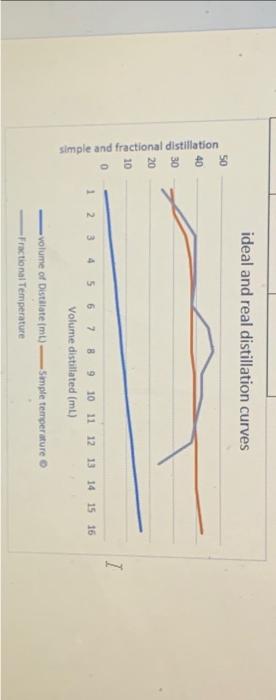
4. Consider the samples in vials 2,3 , and 4. Judging by the appearance of your boiling point curve, which sample appears to be most nearly pure (one component)? Which appears to be least pure? 5. Plot both simple and fractional distillation curves on the same graph and compare the results. Indicate which is your data and which is your partner's data. What do you conclude concerning the effectiveness of using a distilling column? ideal and real distillation curves volume of Distalate (mt)=5 - 4 ple ternperature Fractional Temperature
Step by Step Solution
There are 3 Steps involved in it
1 Expert Approved Answer
Step: 1 Unlock

Question Has Been Solved by an Expert!
Get step-by-step solutions from verified subject matter experts
Step: 2 Unlock
Step: 3 Unlock