

Question: 4. Construct and analyze frequency distributions, histograms, stem and leaf plots, boxplots. NIeIseanetRatlngs Is an Internet media and market research firm. One variable they:r measure
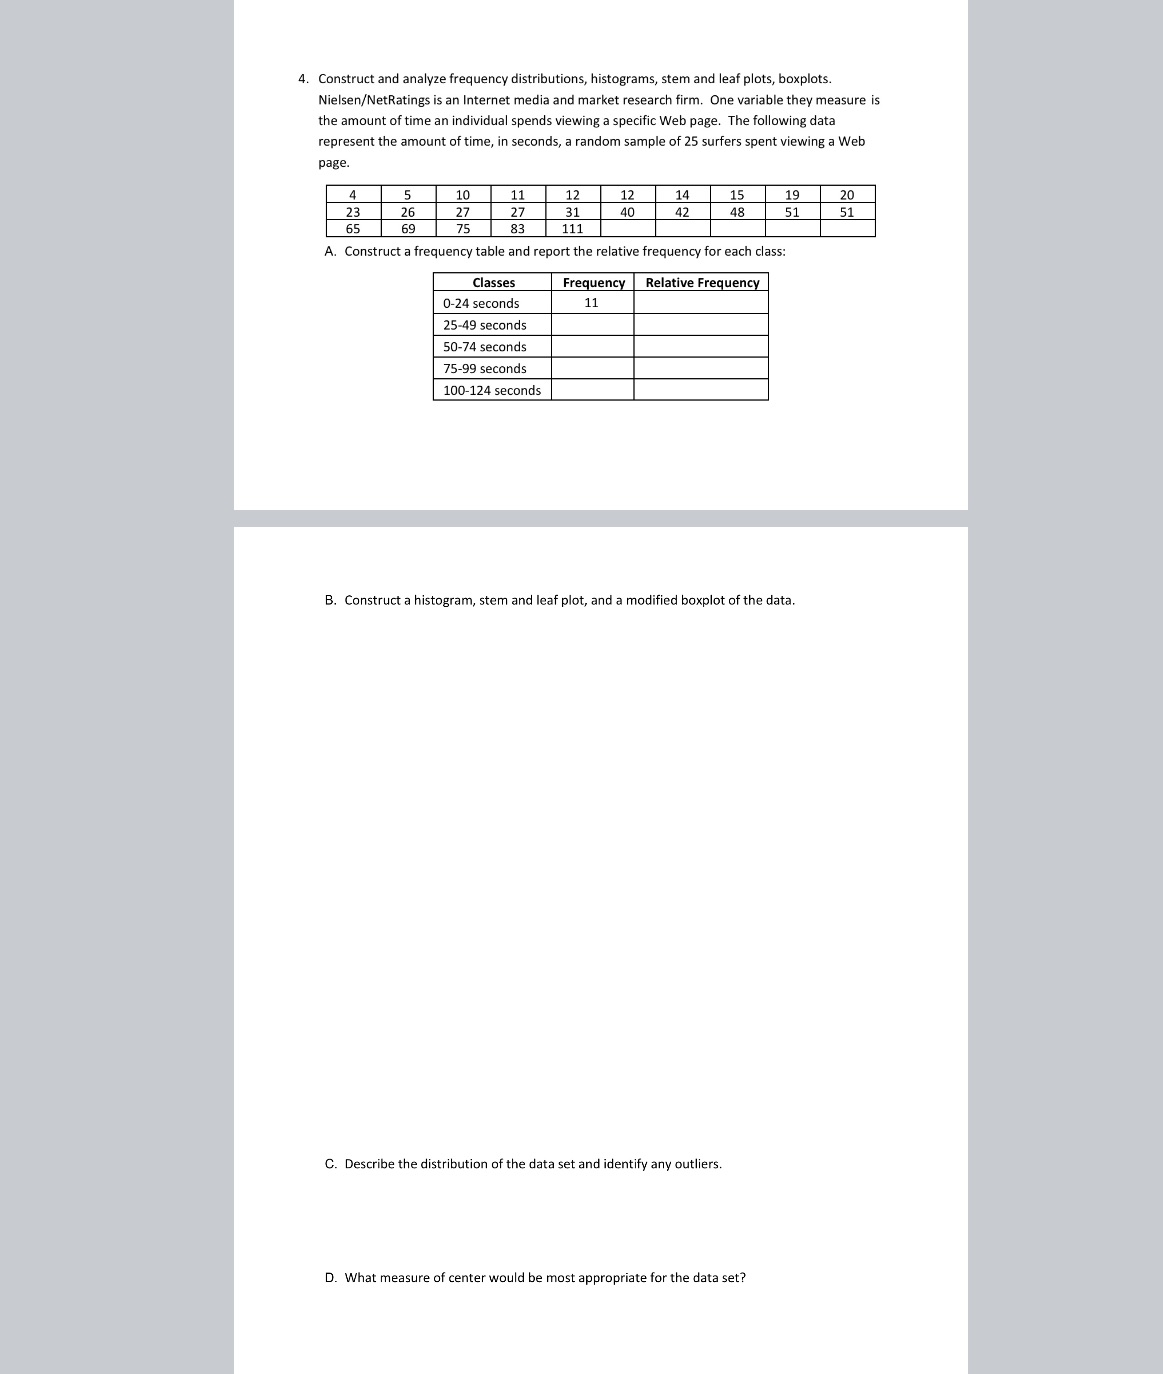
4. Construct and analyze frequency distributions, histograms, stem and leaf plots, boxplots. NIeIseanetRatlngs Is an Internet media and market research firm. One variable they:r measure Is the amount oftime an individual spends viewing a specic Web page. The following data represent the amount of time, in seconds, a random sample of 25 surfers spent viewing a Web page. 10 11 12 2? 2T 31 F'S 83 111 A. Construct a frequencvtable and report the relative frequency for each class: Classes Frequency Relative Frequency 0-24 seconds 25-49 seconds 50-" seconds ?599 seconds 100124 seconds B. Construct a histogram. stern and leaf plot, and a modified hamlet of the data. C. Describe the distribution of the data set and identify amt:I outllers. D. what measure of center would be most appropriate for the data set
Step by Step Solution
There are 3 Steps involved in it

Get step-by-step solutions from verified subject matter experts