

Question: 4. Create a frequency distribution, percent frequency distribution, and histogram for inflation- adjusted U.S. box-office receipts. Use bin sizes of $100 million. Interpret the results.
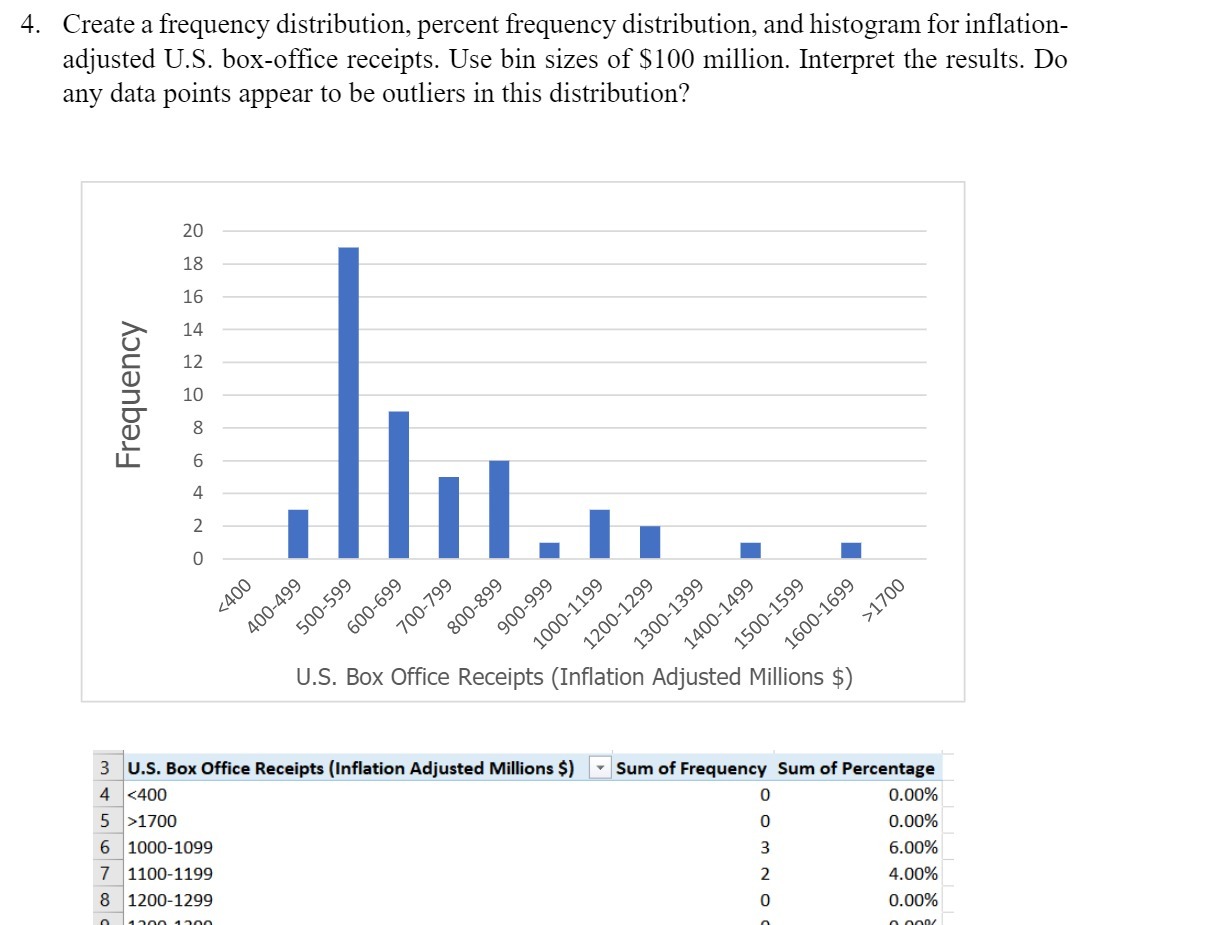

4. Create a frequency distribution, percent frequency distribution, and histogram for inflation- adjusted U.S. box-office receipts. Use bin sizes of $100 million. Interpret the results. Do any data points appear to be outliers in this distribution? 20 18 16 Frequency ONDOOOND 00 799 400-499 500-599 600-699 900-999 00-1299 >1700 700 800 1000-1199 1600-1699 1300 1400 150 U.S. Box Office Receipts (Inflation Adjusted Millions $) 3 U.S. Box Office Receipts (Inflation Adjusted Millions $) * Sum of Frequency Sum of Percentage 1700 0.00% 1000-1099 ONWOO 6.00% 7 1100-1199 4.00% 8 1200-1299 0.00%
Step by Step Solution
There are 3 Steps involved in it
1 Expert Approved Answer
Step: 1 Unlock

Question Has Been Solved by an Expert!
Get step-by-step solutions from verified subject matter experts
Step: 2 Unlock
Step: 3 Unlock