

Question: 4. Create a new file in Excel and enter the data from the Module 2 section Charts, graphs and histograms. The table gives the sales
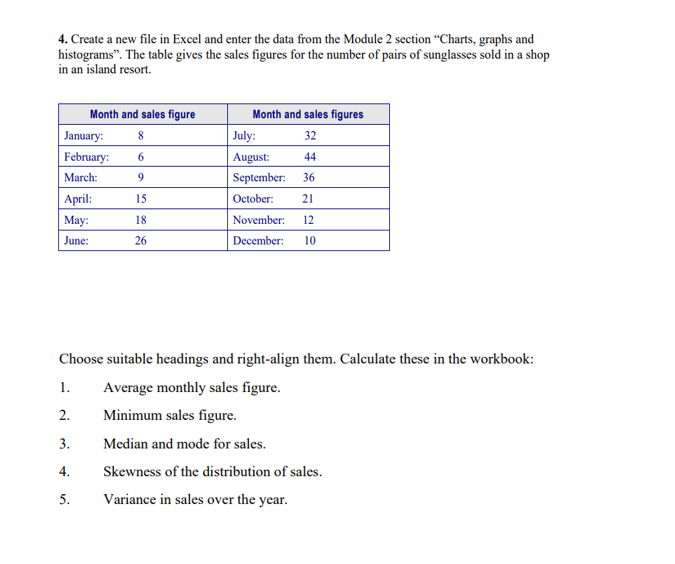
4. Create a new file in Excel and enter the data from the Module 2 section "Charts, graphs and histograms". The table gives the sales figures for the number of pairs of sunglasses sold in a shop in an island resort. Choose suitable headings and right-align them. Calculate these in the workbook: 1. Average monthly sales figure. 2. Minimum sales figure. 3. Median and mode for sales. 4. Skewness of the distribution of sales. 5. Variance in sales over the year
Step by Step Solution
There are 3 Steps involved in it
1 Expert Approved Answer
Step: 1 Unlock

Question Has Been Solved by an Expert!
Get step-by-step solutions from verified subject matter experts
Step: 2 Unlock
Step: 3 Unlock