

Question: 4. Data below lists the times required for randomly selected eight flights to taxi out for takeoff and the corresponding times required to taxi in
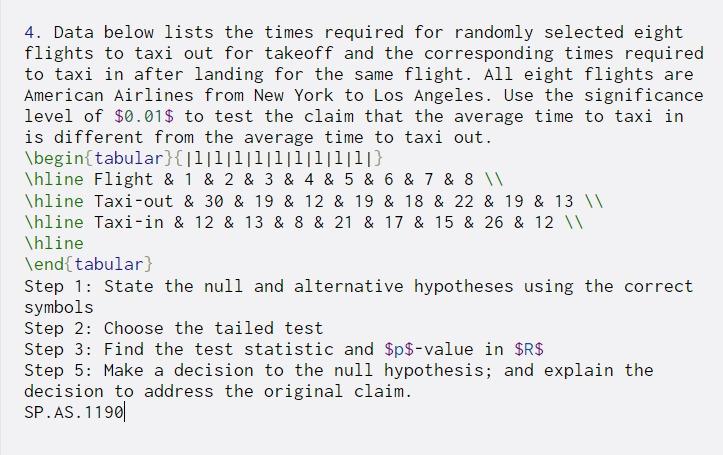
4. Data below lists the times required for randomly selected eight flights to taxi out for takeoff and the corresponding times required to taxi in after landing for the same flight. All eight flights are American Airlines from New York to Los Angeles. Use the significance level of $0.01$ to test the claim that the average time to taxi in is different from the average time to taxi out. \begin{tabular}{|l|l|l|l|l|l|ll|1|} \hline Flight & 1 & 2 & 3 & 4 & 5 & 6 & 7 & 8 \hline Taxi-out & 30 & 19 & 12 & 19 & 18 & 22 & 19 & 13 \hline Taxi-in & 12 & 13 & 8 & 21 & 17 & 15 & 26 & 12 \hline \end{tabular} Step 1: State the null and alternative hypotheses using the correct symbols Step 2: Choose the tailed test Step 3: Find the test statistic and $p$-value in $R$ Step 5: Make a decision to the null hypothesis; and explain the decision to address the original claim. SP.AS. 11901
Step by Step Solution
There are 3 Steps involved in it

Get step-by-step solutions from verified subject matter experts