

Question: 4. Deselect Link plots and click New. In this setting, the box-and-whisker plot is not automatically linked to the line plot. This allows you to
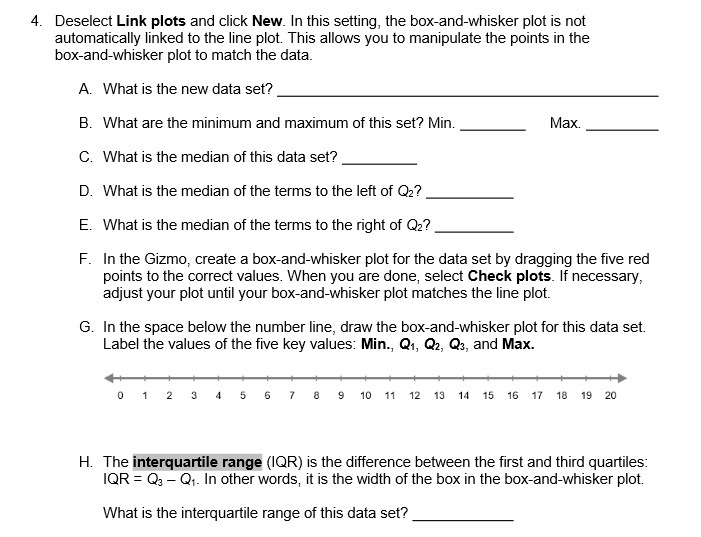
4. Deselect Link plots and click New. In this setting, the box-and-whisker plot is not automatically linked to the line plot. This allows you to manipulate the points in the box-and-whisker plot to match the data. A. What is the new data set? B. What are the minimum and maximum of this set? Min. Max. C. What is the median of this data set? D. What is the median of the terms to the left of Q2? E. What is the median of the terms to the right of Q2? F. In the Gizmo, create a box-and-whisker plot for the data set by dragging the five red points to the correct values. When you are done, select Check plots. If necessary, adjust your plot until your box-and-whisker plot matches the line plot. G. In the space below the number line, draw the box-and-whisker plot for this data set. Label the values of the five key values: Min., Q1, Q2, Q3, and Max. 9 12 13 14 15 16 17 18 19 20 H. The interquartile range (IQR) is the difference between the first and third quartiles: IQR = Q3 - Q1. In other words, it is the width of the box in the box-and-whisker plot. What is the interquartile range of this data set
Step by Step Solution
There are 3 Steps involved in it

Get step-by-step solutions from verified subject matter experts