

Question: 4. Do these graphs represent functions? Explain. 5. Choose one value that is in the domain of both y(x) = x and y? = x
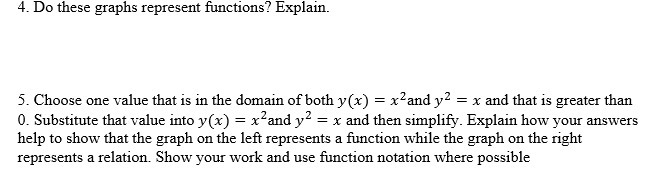
4. Do these graphs represent functions? Explain. 5. Choose one value that is in the domain of both y(x) = x and y? = x and that is greater than 0. Substitute that value into y(x) = x and y = x and then simplify. Explain how your answers help to show that the graph on the left represents a function while the graph on the right represents a relation. Show your work and use function notation where possible
Step by Step Solution
There are 3 Steps involved in it
1 Expert Approved Answer
Step: 1 Unlock

Question Has Been Solved by an Expert!
Get step-by-step solutions from verified subject matter experts
Step: 2 Unlock
Step: 3 Unlock