

Question: 4. Draw the scatter plot for the trade-off data below. The first column represents the total weekly inventory cost for a certain product while the
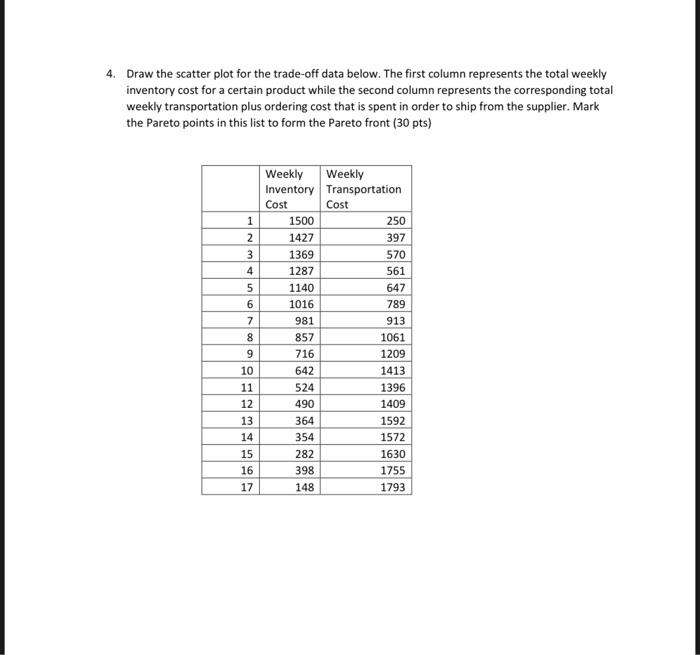
4. Draw the scatter plot for the trade-off data below. The first column represents the total weekly inventory cost for a certain product while the second column represents the corresponding total weekly transportation plus ordering cost that is spent in order to ship from the supplier. Mark the Pareto points in this list to form the Pareto front (30 pts) 1 2 3 4 5 6 7 8 9 10 11 12 13 14 15 16 17 Weekly Weekly Inventory Transportation Cost Cost 1500 250 1427 397 1369 570 1287 561 1140 647 1016 789 981 913 857 1061 716 1209 642 1413 524 1396 490 1409 364 1592 354 1572 282 1630 398 1755 148 1793
Step by Step Solution
There are 3 Steps involved in it
1 Expert Approved Answer
Step: 1 Unlock

Question Has Been Solved by an Expert!
Get step-by-step solutions from verified subject matter experts
Step: 2 Unlock
Step: 3 Unlock