

Question: (4) e. d. Table 2 shows the utility streams which are available at the utility site for the process. Using the grand composite curve from
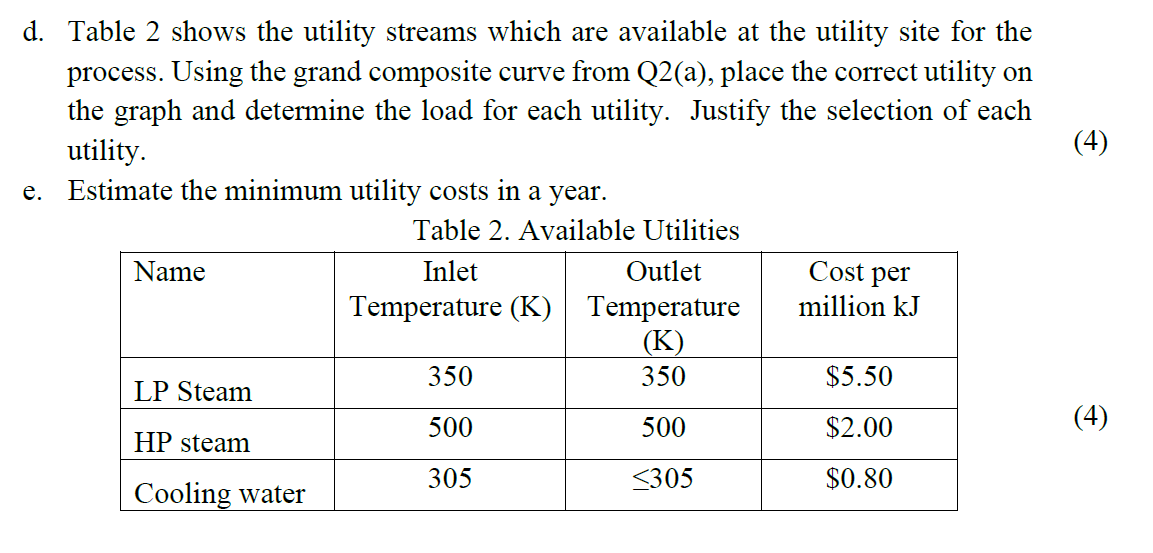
(4) e. d. Table 2 shows the utility streams which are available at the utility site for the process. Using the grand composite curve from Q2(a), place the correct utility on the graph and determine the load for each utility. Justify the selection of each utility. Estimate the minimum utility costs in a year. Table 2. Available Utilities Name Inlet Outlet Temperature (K) Temperature million kJ (K) 350 350 $5.50 LP Steam 500 500 $2.00 HP steam 305
Step by Step Solution
There are 3 Steps involved in it
1 Expert Approved Answer
Step: 1 Unlock

Question Has Been Solved by an Expert!
Get step-by-step solutions from verified subject matter experts
Step: 2 Unlock
Step: 3 Unlock