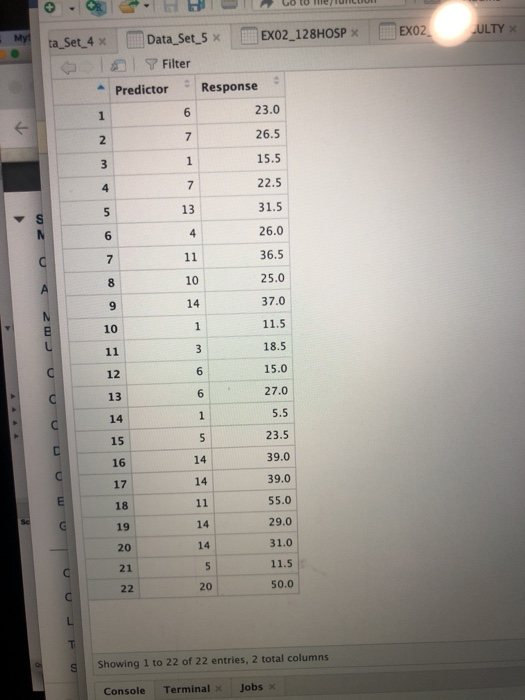
Question: 4) Examine the dataset, S5. Insert a scatterplot with linear regression produced by R or Rstudio. Insert a residual plot. Is there a data point

4) Examine the dataset, S5. Insert a scatterplot
4) Examine the dataset, S5. Insert a scatterplot with linear regression produced by R or Rstudio. Insert a residual plot. Is there a data point that you are concerned about? Why? Remove only one data point that you are concerned about. Replot. What happened to the plot? What happened to the r-squared value? Do you still have concerns? EXO2 ULTY X My ta_Set 4 x Data_Set_5 x EXO2_128HOSP Filter Predictor Response 1 6 23.0 7 26.5 N 3 3 1 15.5 22.5 4 7 5 13 31.5 U 2 4 26.0 en 7 11 36.5 8 10 25.0 9 14 37.0 10 1 11.5 11 3 18.5 12 6 15.0 13 6 27.0 14 1 5.5 15 5 23.5 16 14 39.0 17 14 39.0 E 18 11 55.0 G 19 14 29.0 20 14 31.0 21 5 11.5 22 20 50.0 c L T U Showing 1 to 22 of 22 entries, 2 total columns Console Terminal Jobs

Step by Step Solution

There are 3 Steps involved in it

1 Expert Approved Answer
Step: 1 Unlock blur-text-image
Question Has Been Solved by an Expert!

Get step-by-step solutions from verified subject matter experts

Step: 2 Unlock
Step: 3 Unlock

Students Have Also Explored These Related General Management Questions!