

Question: 4. Expected dividends as a basis for stock values The following graph shows the value of a stock's dividends over time. The stock's current dividend
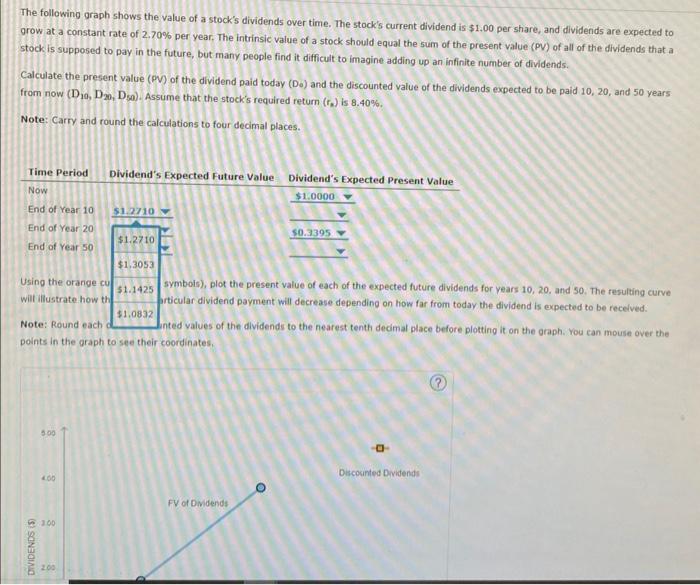
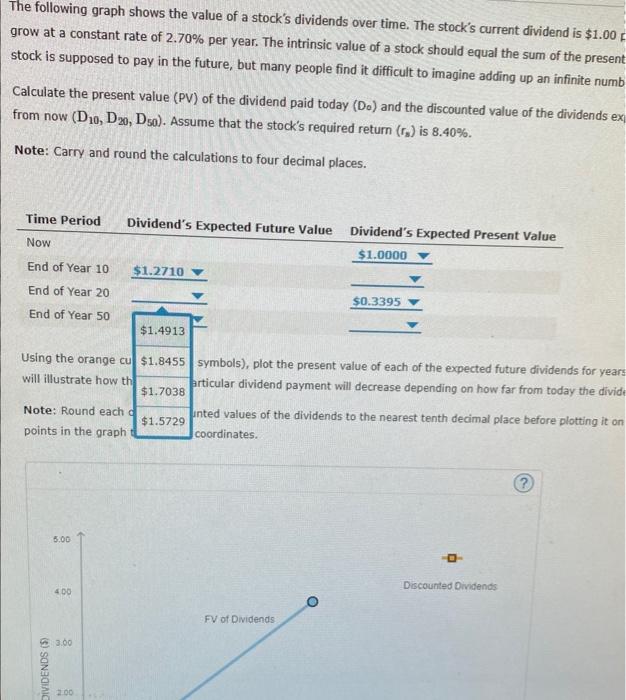
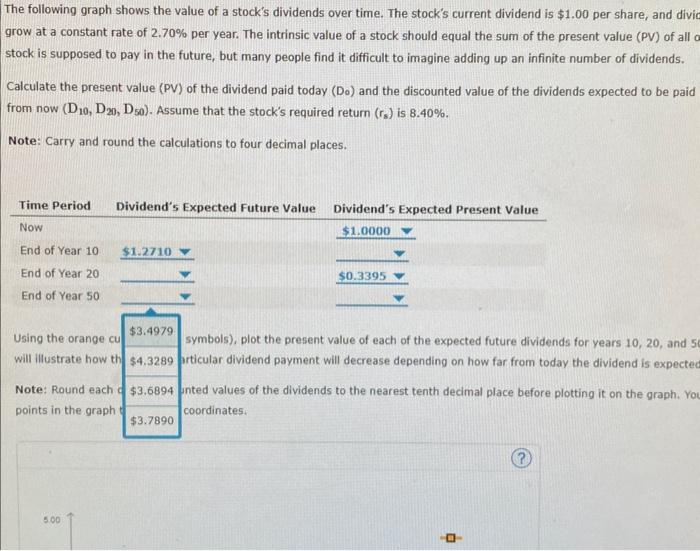
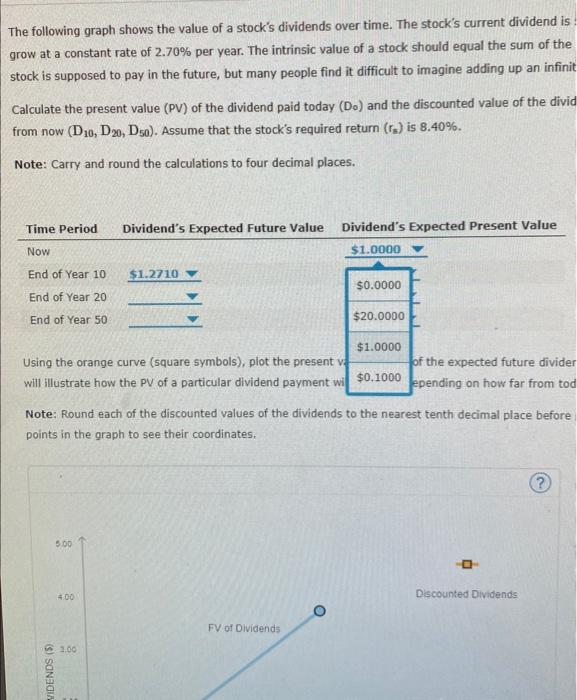
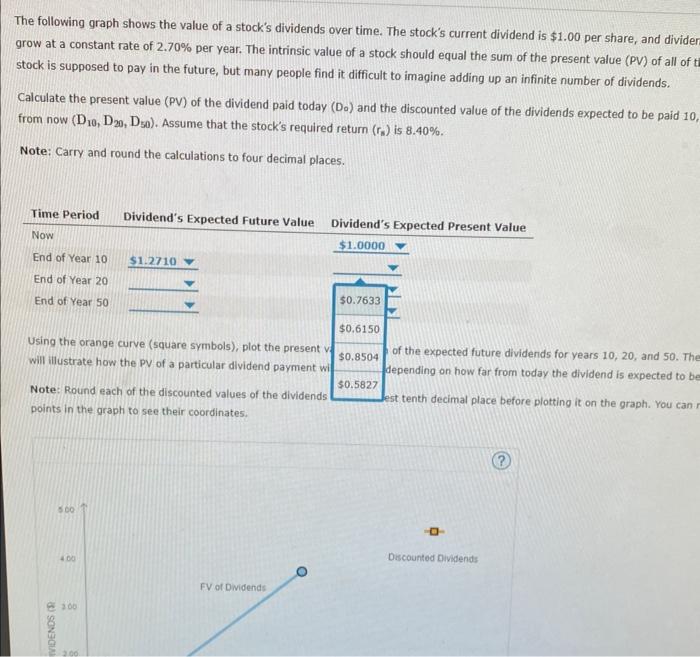
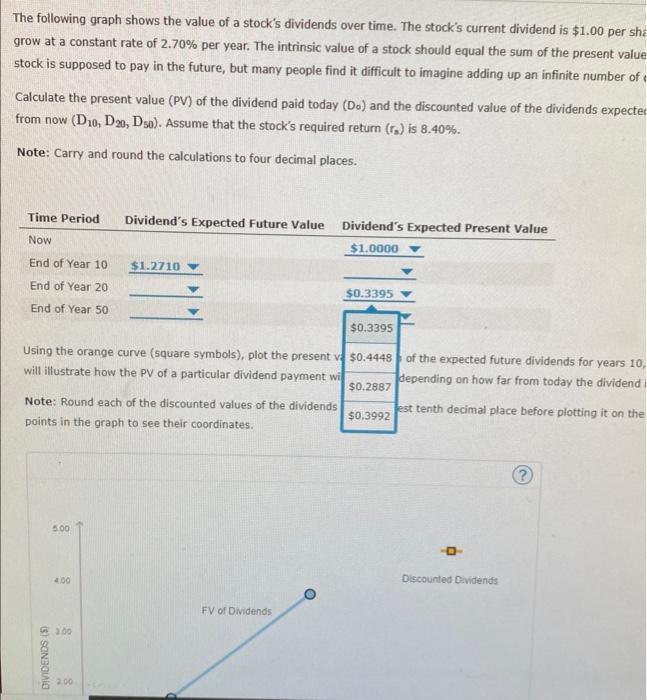
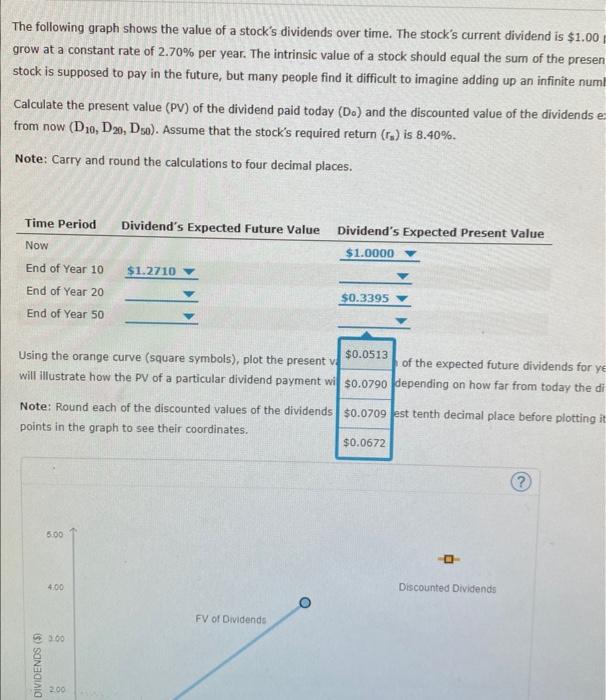
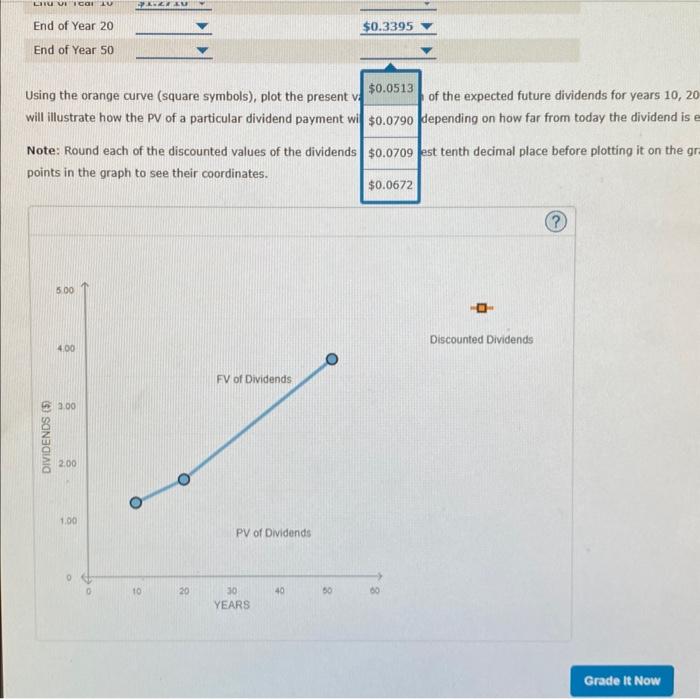
The following graph shows the value of a stock's dividends over time. The stock's current dividend is $1,00 per share, and dividends are expected to grow at a constant rate of 2.70% per year. The intrinsic value of a stock should equal the sum of the present value (py) of all of the dividends that a stock is supposed to pay in the future, but many people find it difficult to imagine adding up an infinite number of dividends. Calculate the present value (PY) of the dividend paid today (Do) and the discounted value of the dividends expected to be paid 10 , 20, and 50 years from now (D10,D20,D30). Assume that the stock's required return (rn) is 8.40%. Note: Carry and round the calculations to four decimal places. Using the orange cu 51.1425 symbois), plot the present value of each of the expected future dividends for years 10, 20. and 50. The resulting curve will illustrate how th $1,0832 prticular dividend payment will decrease depending on how far from today the dividend is expected to be recelved: Note: Round each d fared values of the dividends to the nearest tenth decimal place before plotting it on the graph. You can mouse over the points in the graph to see their coordinates. The following graph shows the value of a stock's dividends over time. The stock's current dividend is $1.00 grow at a constant rate of 2.70% per year. The intrinsic value of a stock should equal the sum of the present stock is supposed to pay in the future, but many people find it difficult to imagine adding up an infinite numb Calculate the present value (PV) of the dividend paid today (D0) and the discounted value of the dividends ex from now (D10,D20,D50). Assume that the stock's required return (rs) is 8.40%. Note: Carry and round the calculations to four decimal places. The following graph shows the value of a stock's dividends over time. The stock's current dividend is $1.00 per share, and divic grow at a constant rate of 2.70% per year. The intrinsic value of a stock should equal the sum of the present value (PV) of all stock is supposed to pay in the future, but many people find it difficult to imagine adding up an infinite number of dividends. Calculate the present value (PV) of the dividend paid today (Do) and the discounted value of the dividends expected to be paid from now (D10,D20,D50). Assume that the stock's required return (rs) is 8.40%. Note: Carry and round the calculations to four decimal places. Using the orange cu symbols), plot the present value of each of the expected future dividends for years 10, 20, and 5 will illustrate how th irticular dividend payment will decrease depending on how far from today the dividend is expected Note: Round each inted values of the dividends to the nearest tenth decimal place before plotting it on the graph. You points in the graph coordinates. The following graph shows the value of a stock's dividends over time. The stock's current dividend is : grow at a constant rate of 2.70% per year. The intrinsic value of a stock should equal the sum of the stock is supposed to pay in the future, but many people find it difficult to imagine adding up an infinit Calculate the present value (PV) of the dividend paid today (D0) and the discounted value of the divid from now (D10,D20,D50). Assume that the stock's required return (rs) is 8.40%. Note: Carry and round the calculations to four decimal places. Using the orange curve (square symbols), plot the present v. will illustrate how the PV of a particular dividend payment wi $0.1000 lopending on how far from tod Note: Round each of the discounted values of the dividends to the nearest tenth decimal place before points in the graph to see their coordinates. The following graph shows the value of a stock's dividends over time. The stock's current dividend is $1.00 per share, and divider grow at a constant rate of 2.70% per year. The intrinsic value of a stock should equal the sum of the present value (PV) of all of stock is supposed to pay in the future, but many people find it difficult to imagine adding up an infinite number of dividends. Calculate the present value (PV) of the dividend paid today (Do) and the discounted value of the dividends expected to be paid 10 , from now (D10,D20,D50). Assume that the stock's required return (rs) is 8.40%. Note: Carry and round the calculations to four decimal places. will illustrate how the PV of a particular dividend payment wi $0.8504 depending on how far from today the dividend is expected to be Note: Round each of the discounted values of the dividends points in the graph to see their coordinates. The following graph shows the value of a stock's dividends over time. The stock's current dividend is $1.00 per sha grow at a constant rate of 2.70% per year. The intrinsic value of a stock should equal the sum of the present value stock is supposed to pay in the future, but many people find it difficult to imagine adding up an infinite number of Calculate the present value (PV) of the dividend paid today (Do) and the discounted value of the dividends expecte from now (D10,D20,D50). Assume that the stock's required return (r3) is 8.40%. Note: Carry and round the calculations to four decimal places. Using the orange curve (square symbols), plot the present v, $0.4448, of the expected future dividends for years 10 , will illustrate how the PV of a particular dividend payment wi $0.2887 depending on how far from today the dividend \begin{tabular}{l|l|l|l} Note: Round each of the discounted values of the dividends & $0.3992 & est tenth decimal place before plotting it on the \end{tabular} points in the graph to see their coordinates. The following graph shows the value of a stock's dividends over time. The stock's current dividend is $1.00 grow at a constant rate of 2.70% per year. The intrinsic value of a stock should equal the sum of the presen stock is supposed to pay in the future, but many people find it difficult to imagine adding up an infinite numl Calculate the present value (PV) of the dividend paid today (D0) and the discounted value of the dividends e from now (D10,D20,D50). Assume that the stock's required return (rs) is 8.40%. Note: Carry and round the calculations to four decimal places. Using the orange curve (square symbols), plot the present vi of the expected future dividends for y t will illustrate how the PV of a particular dividend payment wi depending on how far from today the di Note: Round each of the discounted values of the dividends points in the graph to see their coordinates. Using the orange curve (square symbols), plot the present ve $0.0513 of the expected future dividends for years 10,20 will illustrate how the PV of a particular dividend payment wi $0.0790 depending on how far from today the dividend is Note: Round each of the discounted values of the dividends $0.0709 est tenth decimal place before plotting it on the gr points in the graph to see their coordinates. The following graph shows the value of a stock's dividends over time. The stock's current dividend is $1,00 per share, and dividends are expected to grow at a constant rate of 2.70% per year. The intrinsic value of a stock should equal the sum of the present value (py) of all of the dividends that a stock is supposed to pay in the future, but many people find it difficult to imagine adding up an infinite number of dividends. Calculate the present value (PY) of the dividend paid today (Do) and the discounted value of the dividends expected to be paid 10 , 20, and 50 years from now (D10,D20,D30). Assume that the stock's required return (rn) is 8.40%. Note: Carry and round the calculations to four decimal places. Using the orange cu 51.1425 symbois), plot the present value of each of the expected future dividends for years 10, 20. and 50. The resulting curve will illustrate how th $1,0832 prticular dividend payment will decrease depending on how far from today the dividend is expected to be recelved: Note: Round each d fared values of the dividends to the nearest tenth decimal place before plotting it on the graph. You can mouse over the points in the graph to see their coordinates. The following graph shows the value of a stock's dividends over time. The stock's current dividend is $1.00 grow at a constant rate of 2.70% per year. The intrinsic value of a stock should equal the sum of the present stock is supposed to pay in the future, but many people find it difficult to imagine adding up an infinite numb Calculate the present value (PV) of the dividend paid today (D0) and the discounted value of the dividends ex from now (D10,D20,D50). Assume that the stock's required return (rs) is 8.40%. Note: Carry and round the calculations to four decimal places. The following graph shows the value of a stock's dividends over time. The stock's current dividend is $1.00 per share, and divic grow at a constant rate of 2.70% per year. The intrinsic value of a stock should equal the sum of the present value (PV) of all stock is supposed to pay in the future, but many people find it difficult to imagine adding up an infinite number of dividends. Calculate the present value (PV) of the dividend paid today (Do) and the discounted value of the dividends expected to be paid from now (D10,D20,D50). Assume that the stock's required return (rs) is 8.40%. Note: Carry and round the calculations to four decimal places. Using the orange cu symbols), plot the present value of each of the expected future dividends for years 10, 20, and 5 will illustrate how th irticular dividend payment will decrease depending on how far from today the dividend is expected Note: Round each inted values of the dividends to the nearest tenth decimal place before plotting it on the graph. You points in the graph coordinates. The following graph shows the value of a stock's dividends over time. The stock's current dividend is : grow at a constant rate of 2.70% per year. The intrinsic value of a stock should equal the sum of the stock is supposed to pay in the future, but many people find it difficult to imagine adding up an infinit Calculate the present value (PV) of the dividend paid today (D0) and the discounted value of the divid from now (D10,D20,D50). Assume that the stock's required return (rs) is 8.40%. Note: Carry and round the calculations to four decimal places. Using the orange curve (square symbols), plot the present v. will illustrate how the PV of a particular dividend payment wi $0.1000 lopending on how far from tod Note: Round each of the discounted values of the dividends to the nearest tenth decimal place before points in the graph to see their coordinates. The following graph shows the value of a stock's dividends over time. The stock's current dividend is $1.00 per share, and divider grow at a constant rate of 2.70% per year. The intrinsic value of a stock should equal the sum of the present value (PV) of all of stock is supposed to pay in the future, but many people find it difficult to imagine adding up an infinite number of dividends. Calculate the present value (PV) of the dividend paid today (Do) and the discounted value of the dividends expected to be paid 10 , from now (D10,D20,D50). Assume that the stock's required return (rs) is 8.40%. Note: Carry and round the calculations to four decimal places. will illustrate how the PV of a particular dividend payment wi $0.8504 depending on how far from today the dividend is expected to be Note: Round each of the discounted values of the dividends points in the graph to see their coordinates. The following graph shows the value of a stock's dividends over time. The stock's current dividend is $1.00 per sha grow at a constant rate of 2.70% per year. The intrinsic value of a stock should equal the sum of the present value stock is supposed to pay in the future, but many people find it difficult to imagine adding up an infinite number of Calculate the present value (PV) of the dividend paid today (Do) and the discounted value of the dividends expecte from now (D10,D20,D50). Assume that the stock's required return (r3) is 8.40%. Note: Carry and round the calculations to four decimal places. Using the orange curve (square symbols), plot the present v, $0.4448, of the expected future dividends for years 10 , will illustrate how the PV of a particular dividend payment wi $0.2887 depending on how far from today the dividend \begin{tabular}{l|l|l|l} Note: Round each of the discounted values of the dividends & $0.3992 & est tenth decimal place before plotting it on the \end{tabular} points in the graph to see their coordinates. The following graph shows the value of a stock's dividends over time. The stock's current dividend is $1.00 grow at a constant rate of 2.70% per year. The intrinsic value of a stock should equal the sum of the presen stock is supposed to pay in the future, but many people find it difficult to imagine adding up an infinite numl Calculate the present value (PV) of the dividend paid today (D0) and the discounted value of the dividends e from now (D10,D20,D50). Assume that the stock's required return (rs) is 8.40%. Note: Carry and round the calculations to four decimal places. Using the orange curve (square symbols), plot the present vi of the expected future dividends for y t will illustrate how the PV of a particular dividend payment wi depending on how far from today the di Note: Round each of the discounted values of the dividends points in the graph to see their coordinates. Using the orange curve (square symbols), plot the present ve $0.0513 of the expected future dividends for years 10,20 will illustrate how the PV of a particular dividend payment wi $0.0790 depending on how far from today the dividend is Note: Round each of the discounted values of the dividends $0.0709 est tenth decimal place before plotting it on the gr points in the graph to see their coordinates
Step by Step Solution
There are 3 Steps involved in it

Get step-by-step solutions from verified subject matter experts