

Question: 4. Experimental data are collected as: x[1001 1, 2, 3, 4, 5, 6, 7, 8, 9, 10, 11, 12, 13, 14, 15, 16, 17, 18,
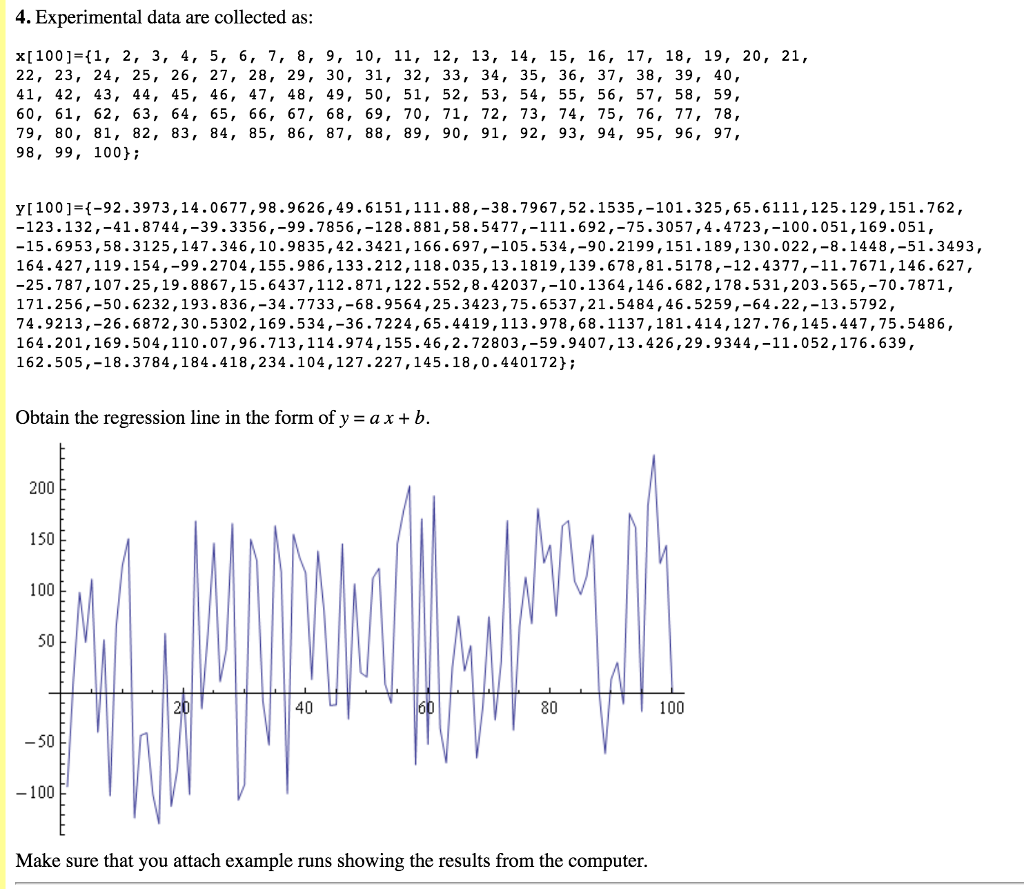
4. Experimental data are collected as: x[1001 1, 2, 3, 4, 5, 6, 7, 8, 9, 10, 11, 12, 13, 14, 15, 16, 17, 18, 19, 20, 21 22, 23, 24, 25, 26, 27, 28, 29, 30, 31, 32, 33, 34, 35, 36, 37, 38, 39, 40, 41, 42, 43, 44, 45, 46, 47, 48, 49, 50, 51, 52, 53, 54, 55, 56, 57, 58, 59, 60, 61, 62, 63, 64, 65, 66, 67, 68, 69, 70, 71, 72, 73, 74, 75, 76, 77, 78, 79, 80, 81, 82, 83, 84, 85, 86, 87, 88, 89, 90, 91, 92, 93, 94, 95, 96,97, 98, 99, 100; YI1001-92.3973,14.0677,98.9626,49.6151,111.88,-38.7967,52.1535,-101.325,65.6111,125.129,151.762, -123.132,-41.8744,-39.3356,-99.7856,-128.881,58.5477,-111.692,-75.3057,4.4723,-100.051,169.051, -15.6953,58.3125,147.346,10.9835,42.3421,166.697,-105.534,-90.2199,151.189,130.022,-8.1448,-51.3493, 164.427,119.154,-99.2704,155.986,133.212,118.035,13.1819,139.678,81.5178,-12.4377,-11.7671,146.627, 25.787,107.25,19.8867,15.6437,112.871,122.552,8.42037,-10.1364,146.682,178.531,203.565,-70.7871, 171.256,-50.6232,193.836,-34.7733,-68.9564,25.3423,75.6537,21.5484,46.5259,-64.22,-13.5792, 74.9213,-26.6872,30.5302,169.534,-36.7224,65.4419,113.978,68.1137,181.414,127.76,145.447,75.5486, 164.201,169.504,110.07,96.713,114.974,155.46,2.72803,-59.9407,13.426,29.9344,-11.052,176.639, 162.505,-18.3784,184.418, 234.104,127-227,145.18, 0-440172 Obtain the regression line in the form ofy = ax + b. 200 150 100 50 40 80 100 -50 100 Make sure that you attach example runs showing the results from the computer
Step by Step Solution
There are 3 Steps involved in it

Get step-by-step solutions from verified subject matter experts