

Question: 4. Finally, to wrap up this initial exploration, quantify these distributions by computing their summary statistics. The following functions in Rare useful for computing the
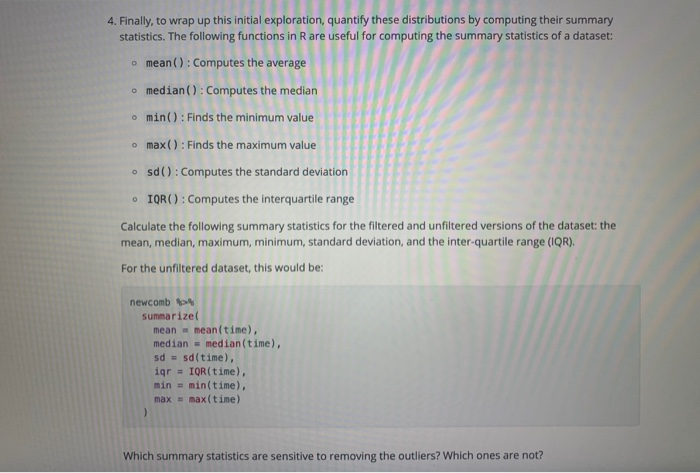
4. Finally, to wrap up this initial exploration, quantify these distributions by computing their summary statistics. The following functions in Rare useful for computing the summary statistics of a dataset: o mean(): Computes the average o median(): Computes the median o min(): Finds the minimum value max(): Finds the maximum value sd(): Computes the standard deviation IQR(): Computes the interquartile range Calculate the following summary statistics for the filtered and unfiltered versions of the dataset: the mean, median, maximum, minimum, standard deviation, and the inter-quartile range (IQR). For the unfiltered dataset, this would be: newcomb summarize mean - mean(time), median = median(time), sd = sd(time), igr = IQR(time), min = min(time), max = max(time) Which summary statistics are sensitive to removing the outliers? Which ones are not? 4. Finally, to wrap up this initial exploration, quantify these distributions by computing their summary statistics. The following functions in Rare useful for computing the summary statistics of a dataset: o mean(): Computes the average o median(): Computes the median o min(): Finds the minimum value max(): Finds the maximum value sd(): Computes the standard deviation IQR(): Computes the interquartile range Calculate the following summary statistics for the filtered and unfiltered versions of the dataset: the mean, median, maximum, minimum, standard deviation, and the inter-quartile range (IQR). For the unfiltered dataset, this would be: newcomb summarize mean - mean(time), median = median(time), sd = sd(time), igr = IQR(time), min = min(time), max = max(time) Which summary statistics are sensitive to removing the outliers? Which ones are not
Step by Step Solution
There are 3 Steps involved in it

Get step-by-step solutions from verified subject matter experts