

Question: 4. Find the sample mean and sample standard deviation for the waist circumference of adult males, using your calculator functions. Round to two decimal places.
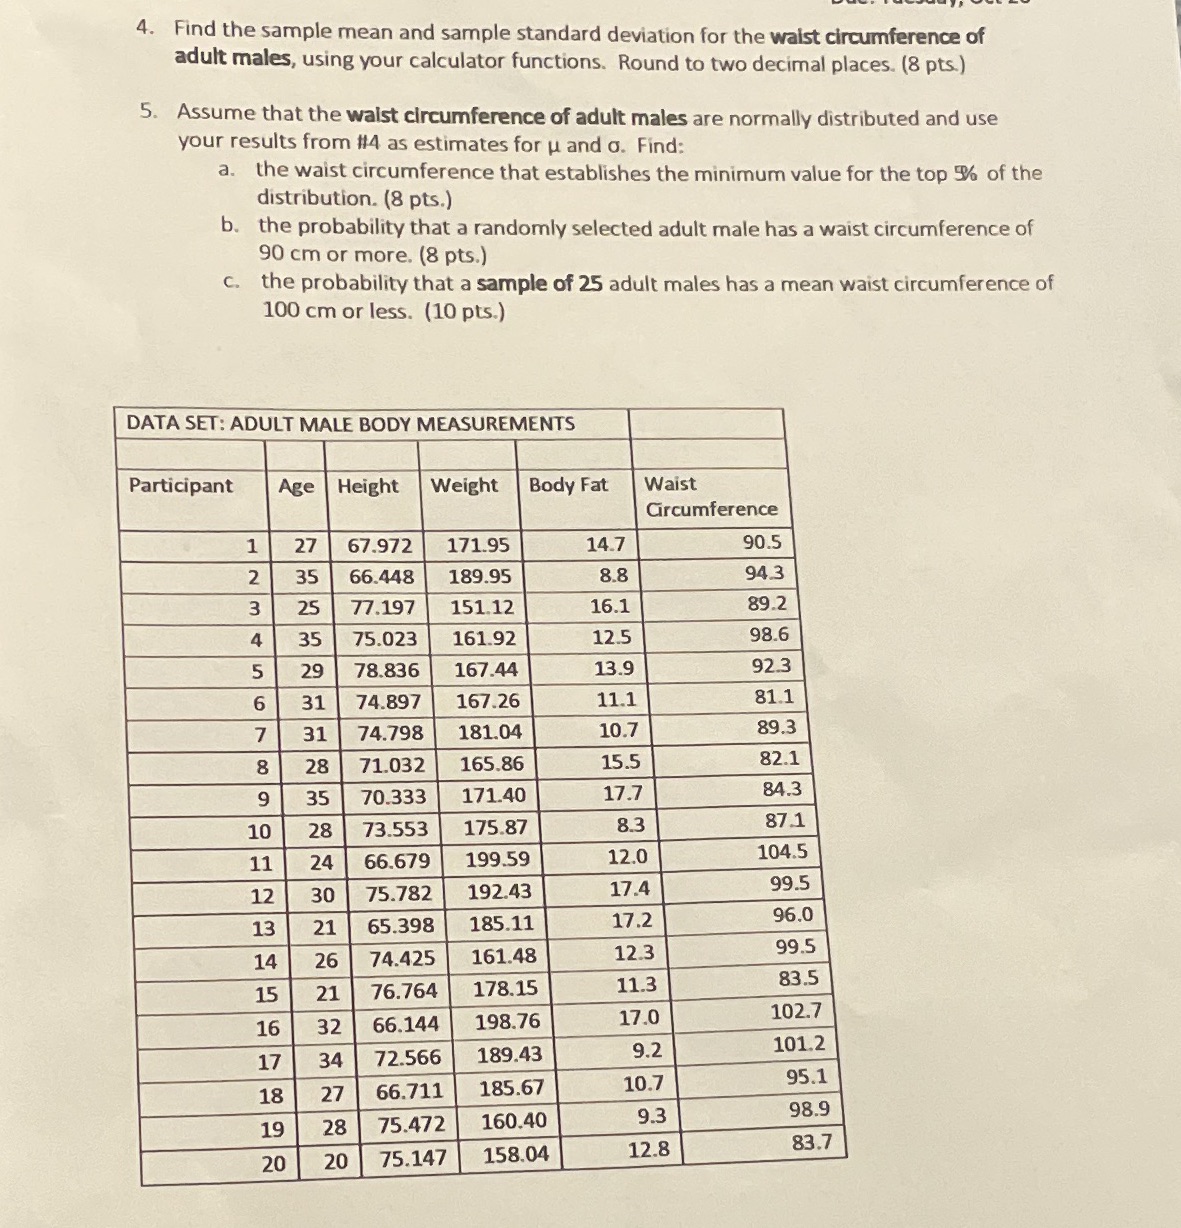
4. Find the sample mean and sample standard deviation for the waist circumference of adult males, using your calculator functions. Round to two decimal places. (8 pts.) 5. Assume that the waist circumference of adult males are normally distributed and use your results from #4 as estimates for u and a. Find: a. the waist circumference that establishes the minimum value for the top % of the distribution. (8 pts.) b. the probability that a randomly selected adult male has a waist circumference of 90 cm or more. (8 pts.) C. the probability that a sample of 25 adult males has a mean waist circumference of 100 cm or less. (10 pts.) DATA SET: ADULT MALE BODY MEASUREMENTS Participant Age | Height Weight Body Fat Waist Circumference 1 27 67.972 171.95 14.7 90.5 35 66.448 189.95 8.8 94.3 W N 25 77.197 151.12 16.1 89. 4 35 75.023 161.92 12.5 98.6 5 29 78.836 167.44 13.9 92.3 6 31 74.897 167.26 11.1 81.1 7 31 74.798 181.04 10.7 89.3 8 28 71.032 165.86 15.5 82.1 9 35 70.333 171.40 17.7 84.3 10 28 73.553 175.87 8.3 871 11 24 66.679 199.59 12.0 104.5 12 30 75.782 192.43 17.4 99.5 13 21 65.398 185.11 17.2 96.0 14 26 74.425 161.48 12.3 99.5 15 21 76.764 178.15 11.3 83.5 16 32 66.144 198.76 17.0 102.7 17 34 72.566 189.43 9.2 101.2 18 27 66.711 185.67 10.7 95.1 19 28 75.472 160.40 9.3 98.9 20 20 75.147 158.04 12.8 83
Step by Step Solution
There are 3 Steps involved in it

Get step-by-step solutions from verified subject matter experts