

Question: 4. For the graph shown below, describe and compare the instantaneous rate of change at the points indicated. Explain your reasoning.[6] Note: You do
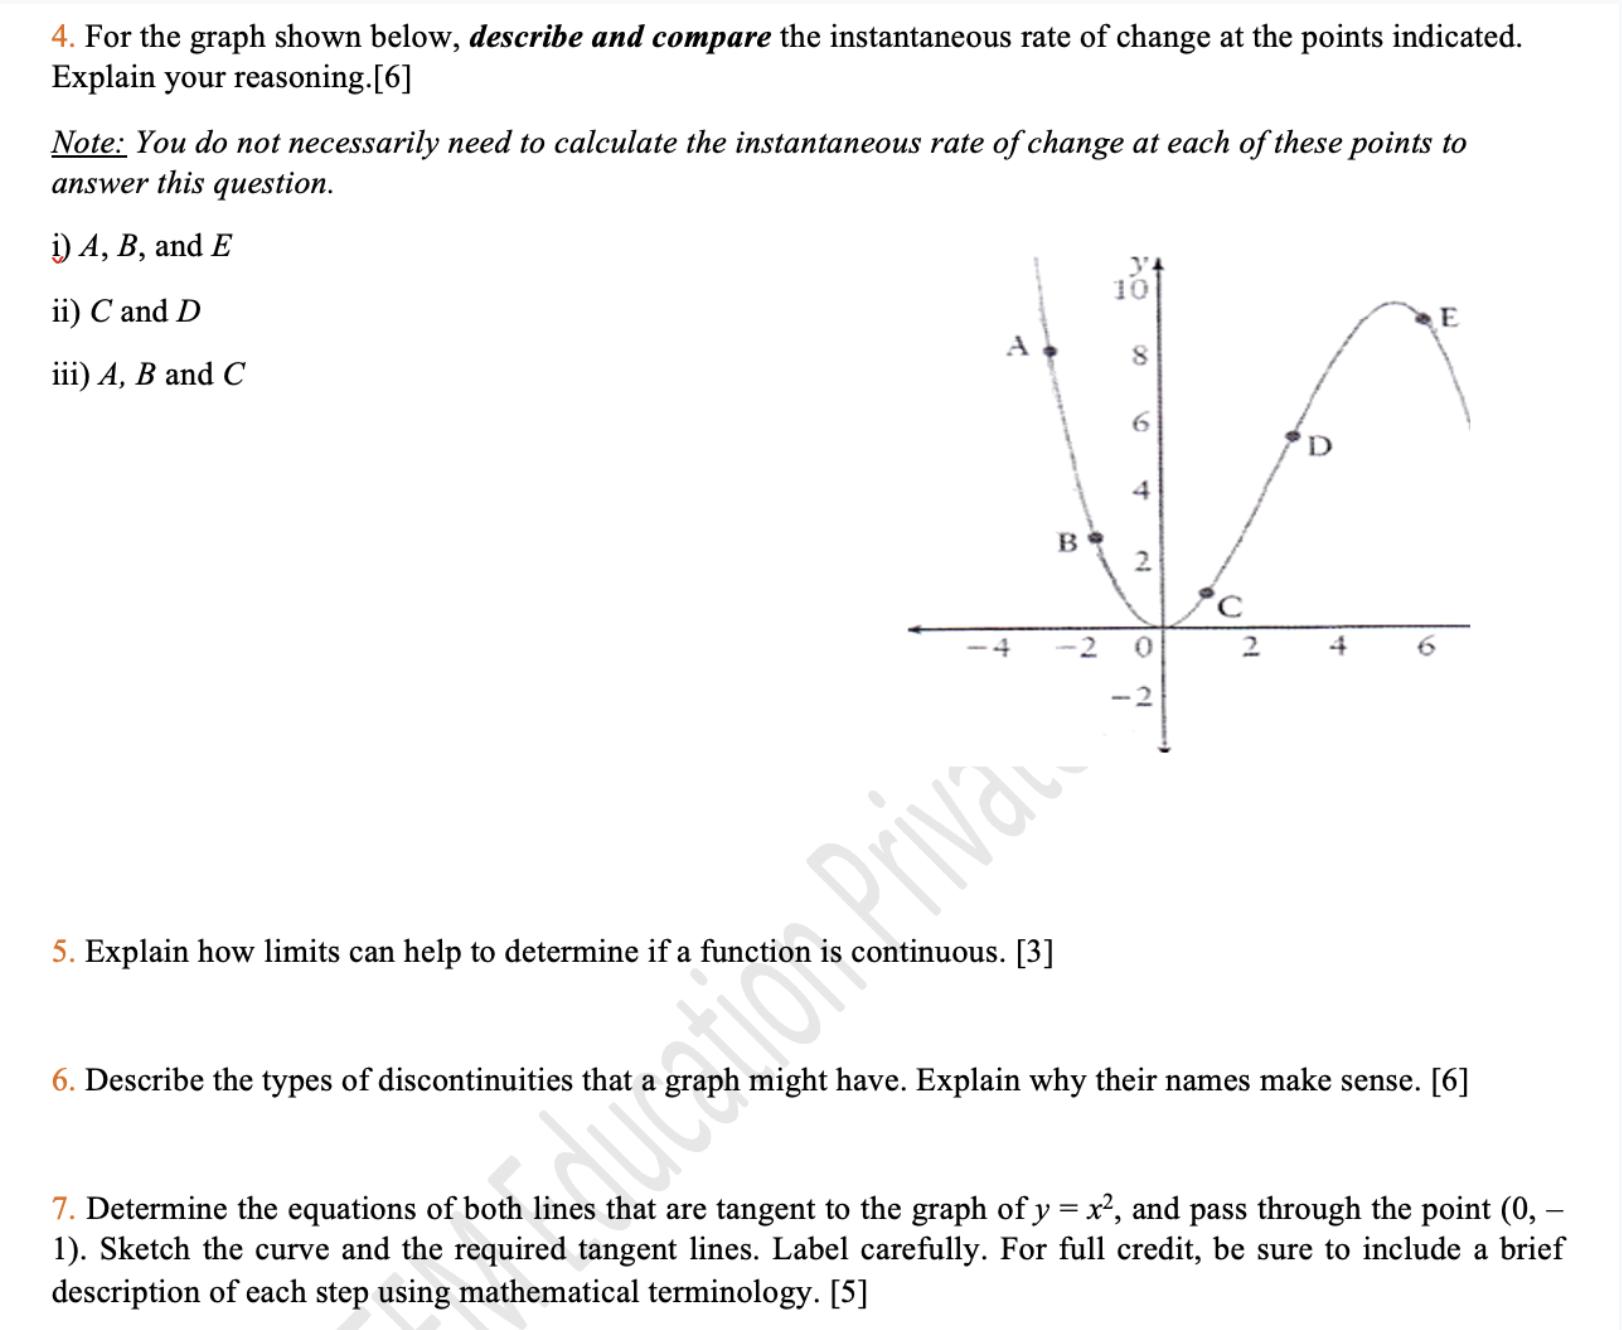
4. For the graph shown below, describe and compare the instantaneous rate of change at the points indicated. Explain your reasoning.[6] Note: You do not necessarily need to calculate the instantaneous rate of change at each of these points to answer this question. i) A, B, and E ii) C and D iii) A, B and C A E 8 6 4 B 2 utation Prival C 2 5. Explain how limits can help to determine if a function is continuous. [3] 2 + 6 6. Describe the types of discontinuities that a graph might have. Explain why their names make sense. [6] 7. Determine the equations of both lines that are tangent to the graph of y = x, and pass through the point (0, - 1). Sketch the curve and the required tangent lines. Label carefully. For full credit, be sure to include a brief description of each step using mathematical terminology. [5]
Step by Step Solution
There are 3 Steps involved in it
Sure here are the correct answers i A B and E At point A the instantaneous rate of change is zero be... View full answer

Get step-by-step solutions from verified subject matter experts