

Question: 4. Given the graph below that shows a student's speed during a 20-minute bike ride. This is not a time vs. distance graph as was
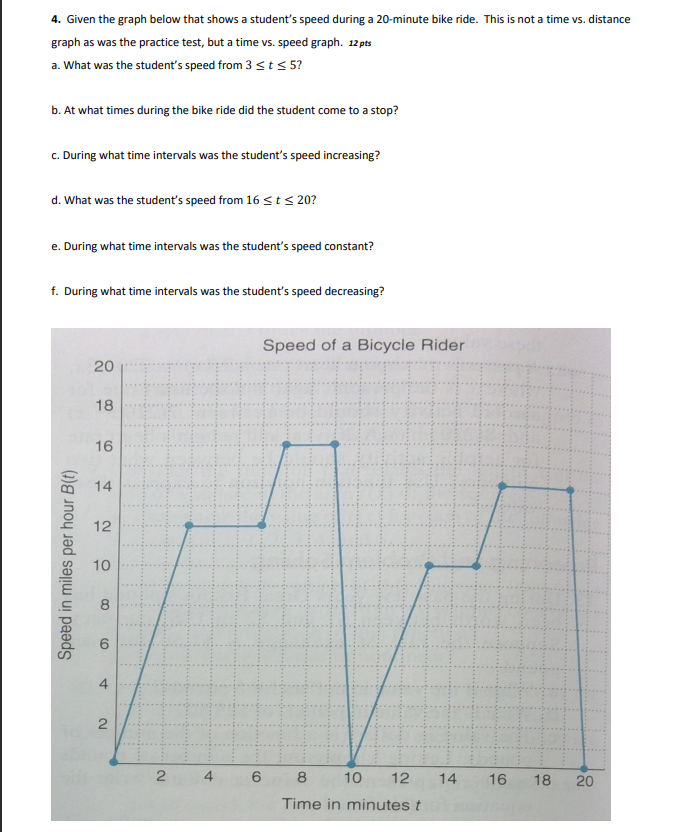
4. Given the graph below that shows a student's speed during a 20-minute bike ride. This is not a time vs. distance graph as was the practice test, but a time vs. speed graph. 12pts a. What was the student's speed from 3 s t s 5? b. At what times during the bike ride did the student come to a stop? c. During what time intervals was the student's speed increasing? d. What was the student's speed from 16 s t s 20? e. During what time intervals was the student's speed constant? f. During what time intervals was the student's speed decreasing? Speed of a Bicycle Rider 20 18 16 .. ... 14 12 .. .. Speed in miles per hour B(t) 10 . . . .. 4 ...:... ..j.. 2 2 4 6 8 10 12 14 16 18 20 Time in minutes t
Step by Step Solution
There are 3 Steps involved in it

Get step-by-step solutions from verified subject matter experts