

Question: 4. (i) Classify methods of statistical analysis and briefly explain the situations under which each may be employed. (ii) State the need of studying
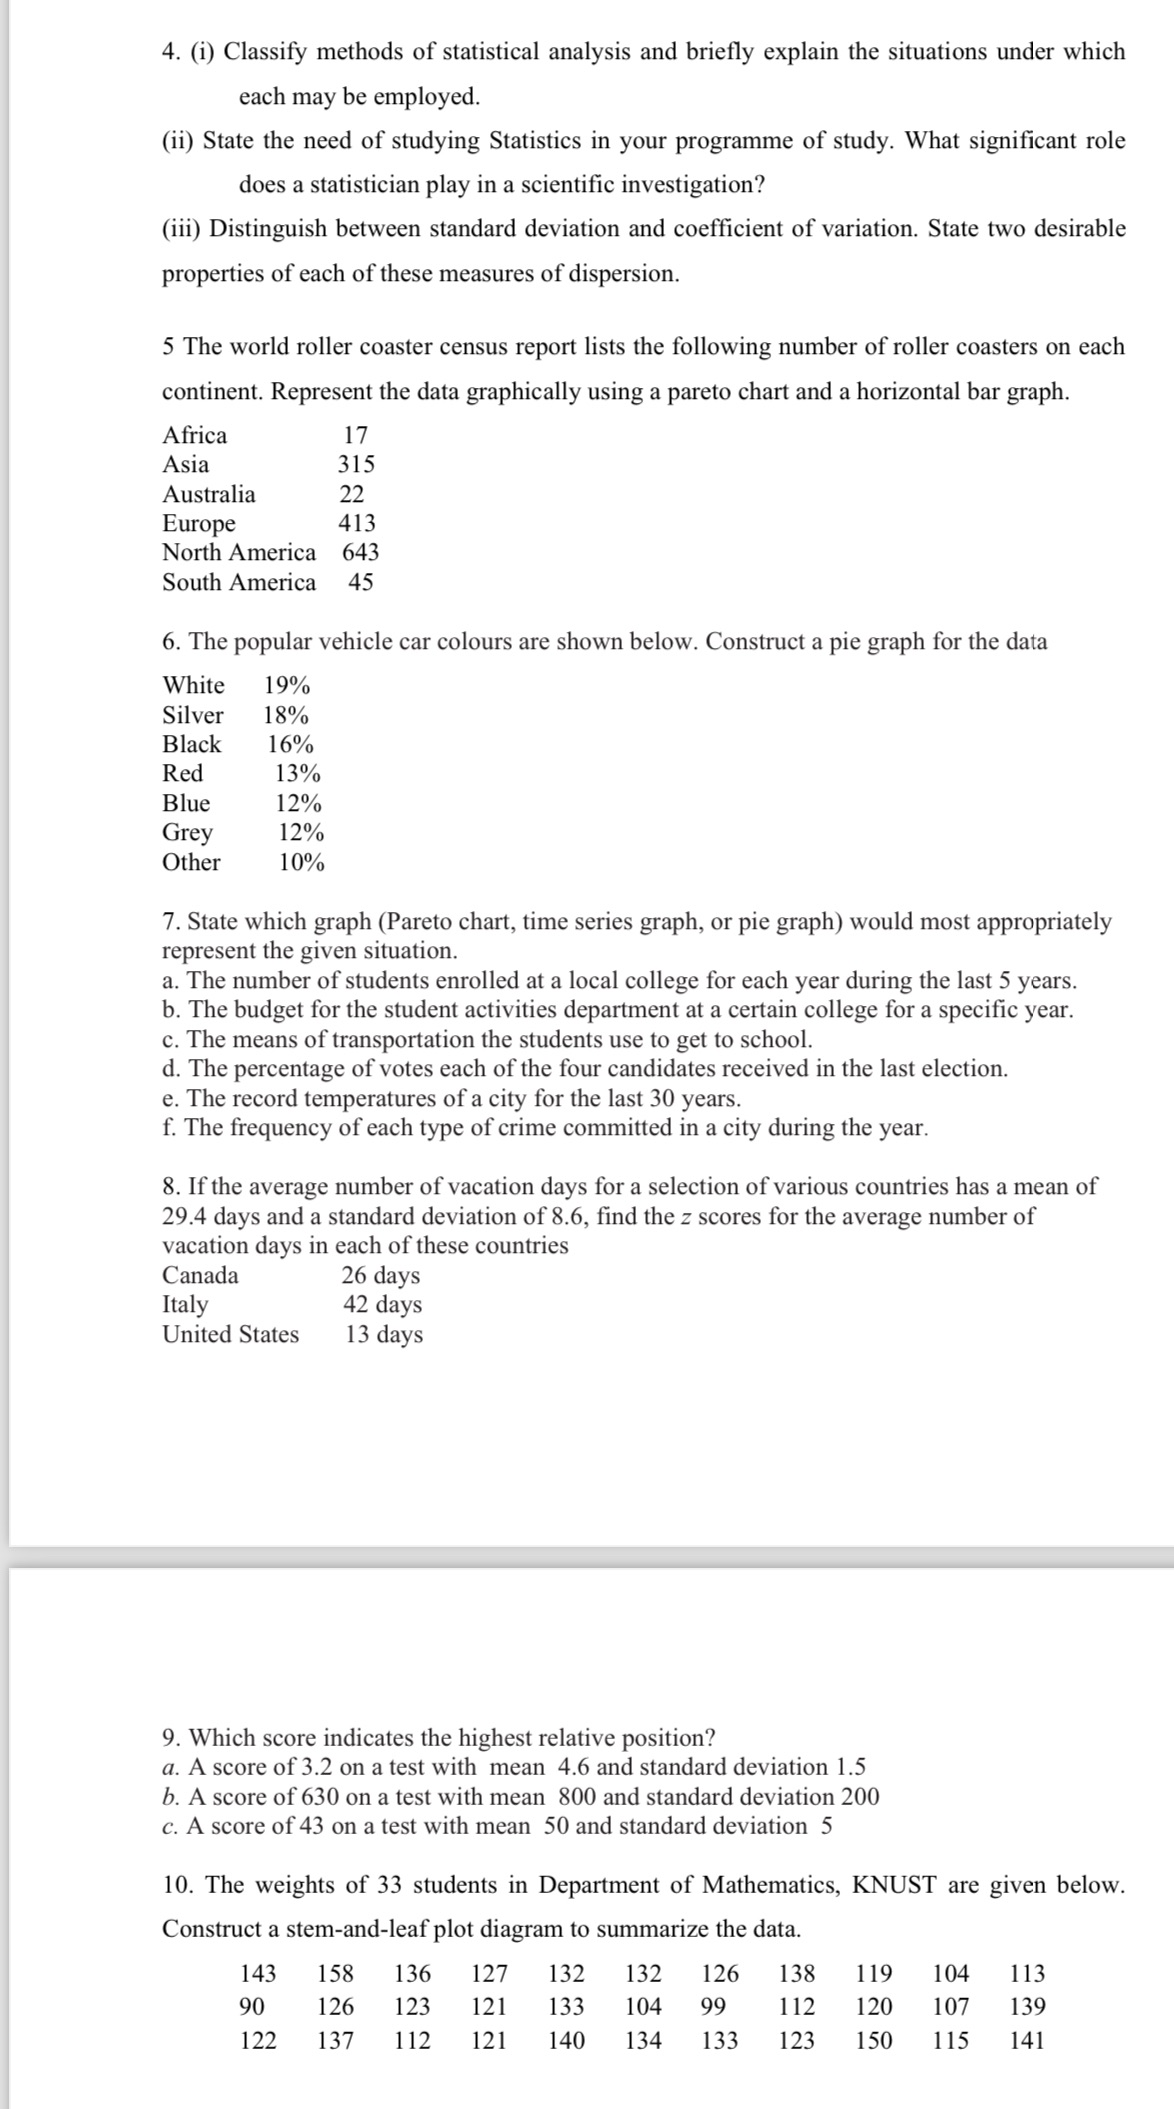
4. (i) Classify methods of statistical analysis and briefly explain the situations under which each may be employed. (ii) State the need of studying Statistics in your programme of study. What significant role does a statistician play in a scientific investigation? (iii) Distinguish between standard deviation and coefficient of variation. State two desirable properties of each of these measures of dispersion. 5 The world roller coaster census report lists the following number of roller coasters on each continent. Represent the data graphically using a pareto chart and a horizontal bar graph. Africa Asia 17 315 Australia Europe 22 413 North America 643 South America 45 6. The popular vehicle car colours are shown below. Construct a pie graph for the data White 19% Silver 18% Black 16% Red 13% Blue 12% Grey 12% Other 10% 7. State which graph (Pareto chart, time series graph, or pie graph) would most appropriately represent the given situation. a. The number of students enrolled at a local college for each year during the last 5 years. b. The budget for the student activities department at a certain college for a specific year. c. The means of transportation the students use to get to school. d. The percentage of votes each of the four candidates received in the last election. e. The record temperatures of a city for the last 30 years. f. The frequency of each type of crime committed in a city during the year. 8. If the average number of vacation days for a selection of various countries has a mean of 29.4 days and a standard deviation of 8.6, find the z scores for the average number of vacation days in each of these countries Canada 26 days Italy 42 days United States 13 days 9. Which score indicates the highest relative position? a. A score of 3.2 on a test with mean 4.6 and standard deviation 1.5 b. A score of 630 on a test with mean 800 and standard deviation 200 c. A score of 43 on a test with mean 50 and standard deviation 5 10. The weights of 33 students in Department of Mathematics, KNUST are given below. Construct a stem-and-leaf plot diagram to summarize the data. 143 158 136 127 132 90 126 123 121 122 137 112 121 133 140 132 126 138 119 104 113 104 99 112 120 107 139 134 133 123 150 115 141
Step by Step Solution
There are 3 Steps involved in it

Get step-by-step solutions from verified subject matter experts