

Question: 4. In the table below is data for two companies in a very competitive industry. ($000) Company A Company B Revenues(net sales) 70, 500 80,000
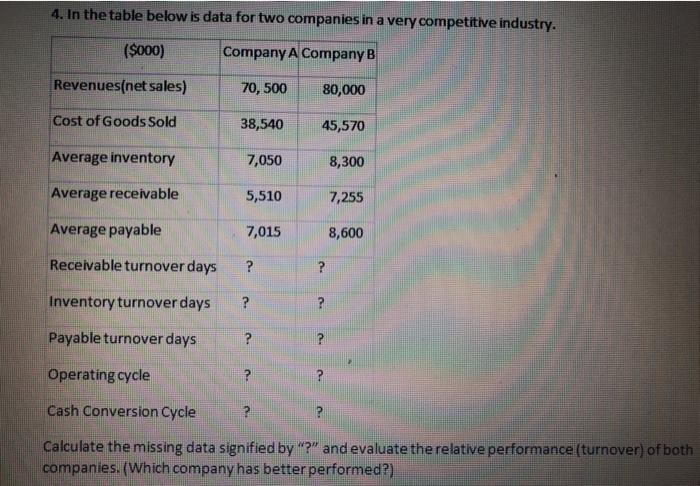
4. In the table below is data for two companies in a very competitive industry. ($000) Company A Company B Revenues(net sales) 70, 500 80,000 Cost of Goods Sold 38,540 45,570 Average inventory 7,050 8,300 Average receivable 5,510 7,255 Average payable 7,015 8,600 Receivable turnover days ? ? Inventory turnover days ? ? Payable turnover days ? ? Operating cycle ? ? Cash Conversion Cycle ? ? Calculate the missing data signified by "?" and evaluate the relative performance (turnover) of both companies. (Which company has better performed?)
Step by Step Solution
There are 3 Steps involved in it
1 Expert Approved Answer
Step: 1 Unlock

Question Has Been Solved by an Expert!
Get step-by-step solutions from verified subject matter experts
Step: 2 Unlock
Step: 3 Unlock