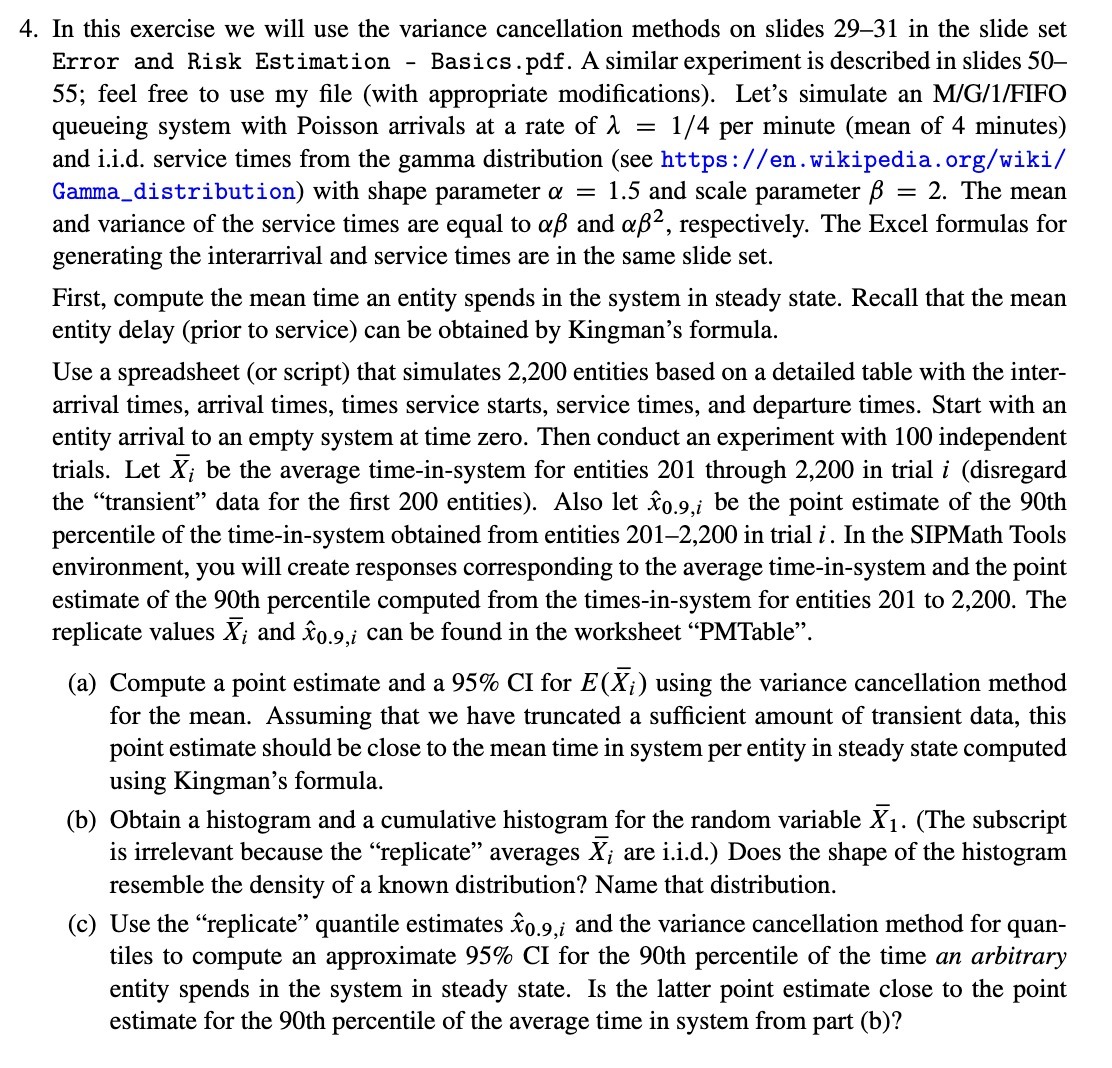
Question: 4. In this exercise we will use the variance cancellation methods on slides 2931 in the slide set Error and Risk Estimation Basics . pdf.

4. In this exercise we will use the variance
4. In this exercise we will use the variance cancellation methods on slides 2931 in the slide set Error and Risk Estimation Basics . pdf. A similar experiment is described in slides 50 55; feel free to use my le (with appropriate modications). Let's simulate an MlG/l/FIFO queueing system with Poisson arrivals at a rate of A = 1/4 per minute (mean of 4 minutes) and i.i.d. service times from the gamma distribution (see https : //en.wikipedia. org/wiki/ Gamma_distribution) with shape parameter a = 1.5 and scale parameter = 2. The mean and variance of the service times are equal to (2)3 and 03,632, respectively. The Excel formulas for generating the interarrival and service times are in the same slide set. First, compute the mean time an entity spends in the system in steady state. Recall that the mean entity delay (prior to service) can be obtained by Kingman's formula. Use a spreadsheet (or script) that simulates 2,200 entities based on a detailed table with the inter- arrival times, arrival times, times service starts, service times, and departure times. Start with an entity arrival to an empty system at time zero. Then conduct an experiment with 100 independent trials. Let f,- be the average time-in-system for entities 201 through 2,200 in trial 1' (disregard the \"transient\" data for the rst 200 entities). Also let 560.9,; be the point estimate of the 90th percentile of the time-in-system obtained from entities 2012,200 in trial 1'. In the SIPMath Tools environment, you will create responses corresponding to the average time-insystem and the point estimate of the 90th percentile computed from the times-in-system for entities 201 to 2,200. The replicate values X ,- and 5503,; can be found in the worksheet \"PMTable\". (a) Compute a point estimate and a 95% CI for E(A7;) using the variance cancellation method for the mean. Assuming that we have truncated a sufcient amount of transient data, this point estimate should be close to the mean time in system per entity in steady state computed using Kingman's formula. (b) Obtain a histogram and a cumulative histogram for the random variable X71. (The subscript is irrelevant because the \"replicate\" averages X g are i.i.d.) Does the shape of the histogram resemble the density of a known distribution? Name that distribution. (0) Use the \"replicate\" quantile estimates 560.9,; and the variance cancellation method for quan- tiles to compute an approximate 95% CI for the 90th percentile of the time an arbitrary entity spends in the system in steady state. Is the latter point estimate close to the point estimate for the 90th percentile of the average time in system from part (b)

Step by Step Solution

There are 3 Steps involved in it

1 Expert Approved Answer
Step: 1 Unlock blur-text-image
Question Has Been Solved by an Expert!

Get step-by-step solutions from verified subject matter experts

Step: 2 Unlock
Step: 3 Unlock

Students Have Also Explored These Related Accounting Questions!