

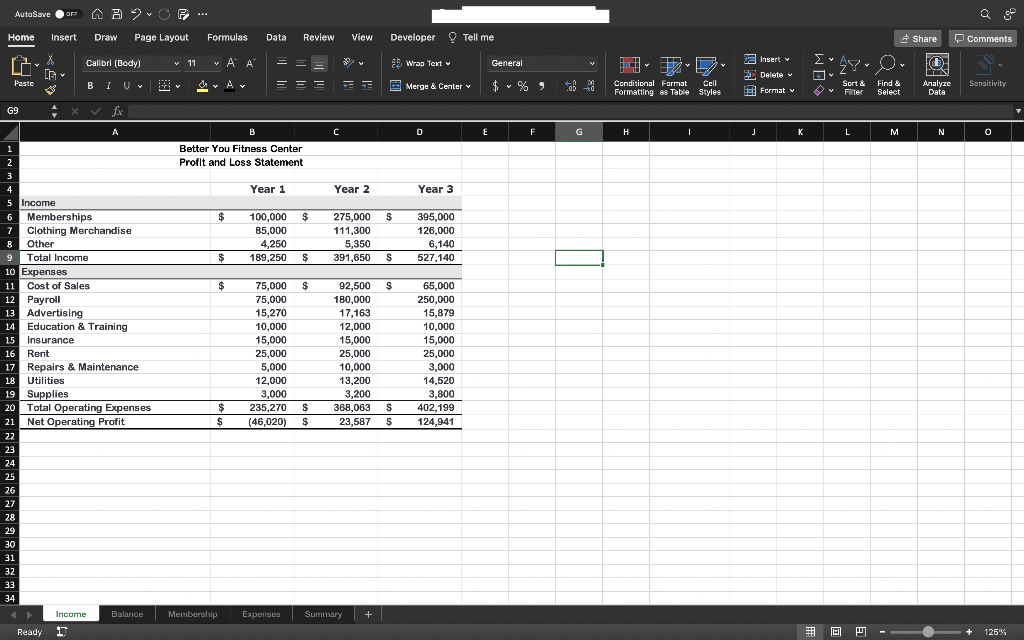
Question: 4. Insert a clustered bar chart using the ranges A4:D4 and A11:D19 on the Income worksheet. Move the chart as an object on the Summary
4. Insert a clustered bar chart using the ranges A4:D4 and A11:D19 on the Income worksheet. Move the chart as an object on the Summary worksheet. Cut the chart and paste it in cell 11. 5. Change the chart title to Expenses (Without Payroll and Cost of Sales). 6. Select the category axis and use the Format Axis task pane to display categories in reverse order. 7. Apply a chart filter to remove Payroll and Cost of Sales. 8. Change the Maximum Bound to 25000
AutoSave a OF AA 2 OF ... Home Insert Draw Page Layout Formulas Data Review View Developer Tell me Share 0 Comments v 11 Calibri (Body) ~ Al A X X G General 2 Insert v Wrap Text Y O 0 v Delete Paste Av Y = = = - Merge & Center v Sensitivity Y 0 0 Conditional Format Cell Formatting as Table Styles # Format Sort & Fiter Find & Select Analyze Data V G9 A C D E F G H I J K L M N 0 1 2 3 B Better You Fitness Center Profit and Loss Statement Year 1 Year 2 Year 3 $ S 100,000 85,000 4,250 189,250 275,000 111,300 5,350 391,650 395,000 126,000 6,140 527,140 $ $ S S S 4 5 Income 6 Memberships $ 7 Clothing Merchandise 7 8 Other 9 Total Income $ $ 10 Expenses 11 Cost of Sales $ 12 Payroll 13 Advertising 14 Education & Training 15 Insurance 16 Rent 17 Repairs & Maintenance 18 Utilities 19 Supplies 20 Total Operating Expenses $ 21 Net Operating Profit $ 22 23 24 25 26 27 28 29 30 31 32 33 34 Income Balance Membership Ready 1 75,000 75,000 15,270 10,000 15,000 25,000 5,000 12,000 3,000 235,270 (46,020) 92,500 180,000 17,163 12,000 15,000 25,000 10,000 13,200 3,200 368,063 23,587 65,000 250,000 15,879 10,000 15,000 25,000 3,000 14,520 3,800 402,199 124,941 $ $ S S Expenses Summary + + , + 125% AutoSave a OF AA 2 OF ... Home Insert Draw Page Layout Formulas Data Review View Developer Tell me Share 0 Comments v 11 Calibri (Body) ~ Al A X X G General 2 Insert v Wrap Text Y O 0 v Delete Paste Av Y = = = - Merge & Center v Sensitivity Y 0 0 Conditional Format Cell Formatting as Table Styles # Format Sort & Fiter Find & Select Analyze Data V G9 A C D E F G H I J K L M N 0 1 2 3 B Better You Fitness Center Profit and Loss Statement Year 1 Year 2 Year 3 $ S 100,000 85,000 4,250 189,250 275,000 111,300 5,350 391,650 395,000 126,000 6,140 527,140 $ $ S S S 4 5 Income 6 Memberships $ 7 Clothing Merchandise 7 8 Other 9 Total Income $ $ 10 Expenses 11 Cost of Sales $ 12 Payroll 13 Advertising 14 Education & Training 15 Insurance 16 Rent 17 Repairs & Maintenance 18 Utilities 19 Supplies 20 Total Operating Expenses $ 21 Net Operating Profit $ 22 23 24 25 26 27 28 29 30 31 32 33 34 Income Balance Membership Ready 1 75,000 75,000 15,270 10,000 15,000 25,000 5,000 12,000 3,000 235,270 (46,020) 92,500 180,000 17,163 12,000 15,000 25,000 10,000 13,200 3,200 368,063 23,587 65,000 250,000 15,879 10,000 15,000 25,000 3,000 14,520 3,800 402,199 124,941 $ $ S S Expenses Summary + + , + 125%
Step by Step Solution
There are 3 Steps involved in it

Get step-by-step solutions from verified subject matter experts