

Question: 4. Let the random variable Z have a standard Normal probability distribution. Use the Standard Normal Table to determine the probability for each of the

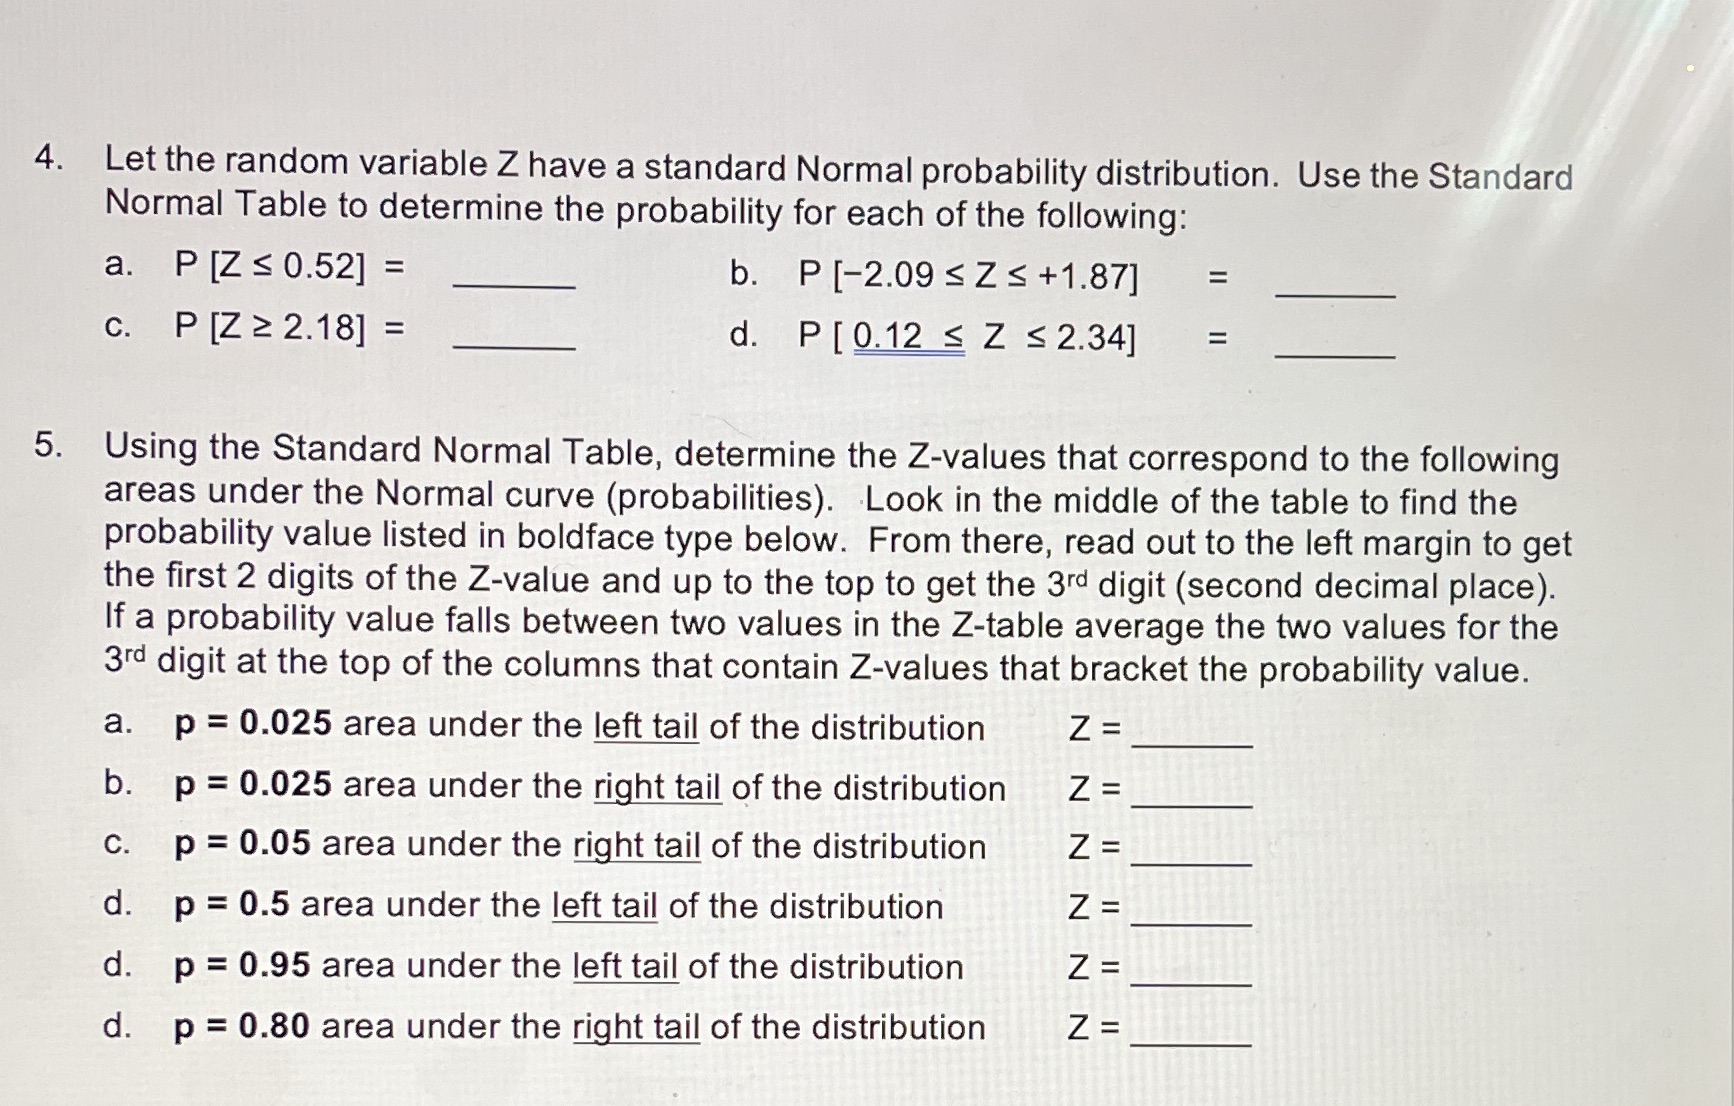
4. Let the random variable Z have a standard Normal probability distribution. Use the Standard Normal Table to determine the probability for each of the following: a. P [Z s 0.52] = b. P [-2.09 s Z S +1.87] c. P [Z Z 2. 18] = d. P [ 0. 12 S Z s 2.34] 5. Using the Standard Normal Table, determine the Z-values that correspond to the following areas under the Normal curve (probabilities). Look in the middle of the table to find the probability value listed in boldface type below. From there, read out to the left margin to get the first 2 digits of the Z-value and up to the top to get the 3rd digit (second decimal place). If a probability value falls between two values in the Z-table average the two values for the 3rd digit at the top of the columns that contain Z-values that bracket the probability value. a. p = 0.025 area under the left tail of the distribution Z = b. p = 0.025 area under the right tail of the distribution Z= c. p = 0.05 area under the right tail of the distribution Z= d. p = 0.5 area under the left tail of the distribution Z = d. p = 0.95 area under the left tail of the distribution Z = d. p = 0.80 area under the right tail of the distribution Z=
Step by Step Solution
There are 3 Steps involved in it

Get step-by-step solutions from verified subject matter experts