

Question: 4. Make a stem and leaf plot of the following data: 30.1, 30.2, 33.1, 33.3, 33.8, 33.8, 40.1, 44.2, 44.3, 44.5 39. If number 38
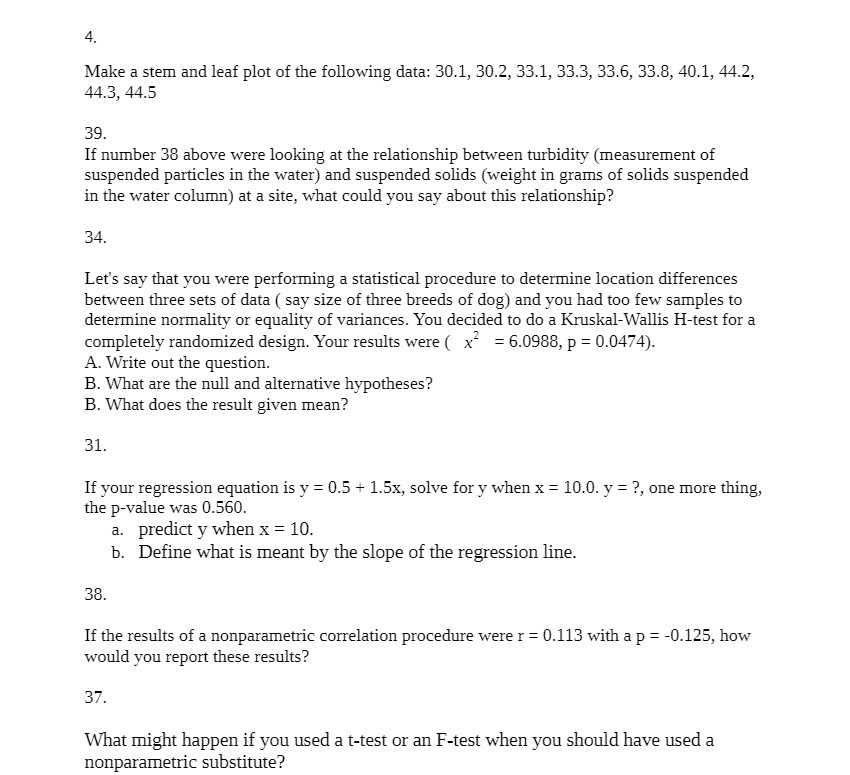
4. Make a stem and leaf plot of the following data: 30.1, 30.2, 33.1, 33.3, 33.8, 33.8, 40.1, 44.2, 44.3, 44.5 39. If number 38 above were looking at the relationship between turbidity (measurement of suspended particles in the water} and suspended solids (weight in grams of solids suspended in the water column) at a site, what could you say about this relationship? 34. Let's say that you were performing a statistical procedure to determine location differences between three sets of data [ say size of three breeds of dog} and you had too few samples to determine normality or equality of variances. You decided to do a KruskalWallis Htest for a completely randomized design. Your results were ( x2 : 5.0388, p : 0.04?4). A. Write out the question. 13. What are the null and alternative hypotheses? B. What does the result given mean? 31. If your regression equation is y = 0.5 + 1.51:, solve for y when x = 10.0. y = ?, one more thing, the p-value was 0.580. a. predict y when X = 10. 1:. Define what is meant by the slope of the regression line. 38. If the results of a nonparamenic correlation procedure were I = 0.113 with a p = 0.125, how would you report these results? 3?. Wt might happen if you used a t-test or an F-test when you should have used a nonparametric substitute
Step by Step Solution
There are 3 Steps involved in it

Get step-by-step solutions from verified subject matter experts