Question: 4 Marks) Respond in MS Excel Q8 APS Complete the APS model in Excel. The model assumes the current staffing level is 40 people. For
-
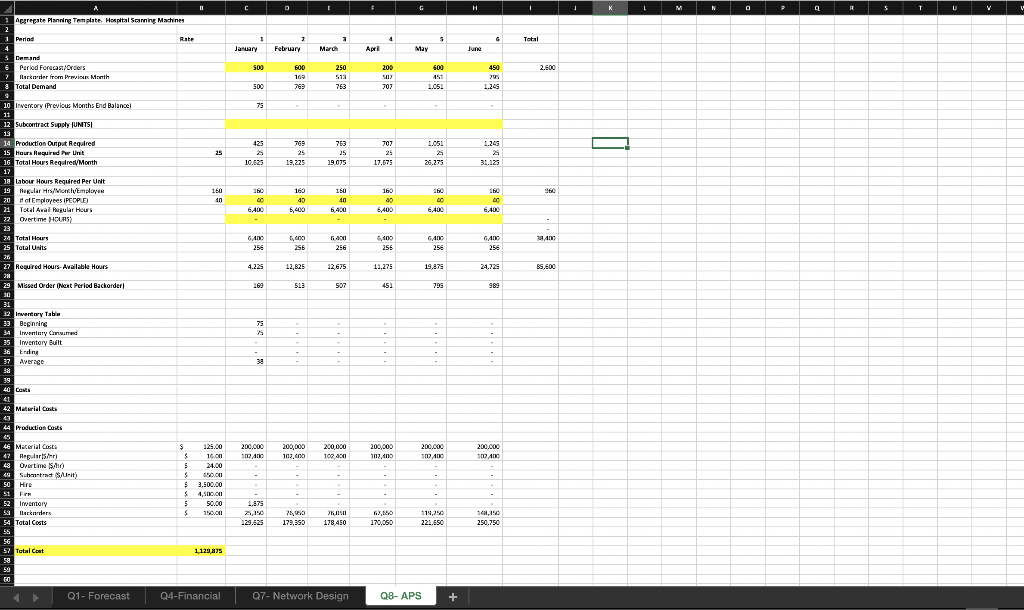 4 Marks) Respond in MS Excel Q8 APS Complete the APS model in Excel. The model assumes the current staffing level is 40 people. For your completed model, backlog is required to be zero. You can Hire/fire employees starting in February. Subcontracting and Overtime can begin immediately.
 - (2 Marks) What is the ultimate goal of the model? Explain the strategies used to meet the goal.
- (2 Marks) Of the strategies to adjust capacity, which is the most flexible and why? Which is the least flexible and why? Why do you think there is a delay in hiring/firing employees?
F4 x fx A B C D E F Dallas $95.00 $88.00 1 2 Per Unit Freight Costs, From the proposed plants, to each destination 3 Philadelphia Atlanta 4 Plant A $94.00 $83.00 5 Plant B $75.00 $88.00 6 7 Cost to Build Each Plant 8 Cost to Build 9 Plant A $23,500.00 10 Plant B $29,000.00 11 12 Annual Demand, in units, Shipped to each city, Assume Demand Does Not Change, Over 3 years 13 Philadelphia Atlanta 14 Demand (#Units) 100 50 Dallas 125 15 16 17 18 19 20 21 22 23 24 25 26 27 28 29 30 31 32 33 34 35 36 37 38 39 40 41 42 43 Q1- Forecast Q4-Financial Q7- Network Design Q8-APS + B C D F G H K L Performance Metrics Home Depot Rona Lowes Home Hardware Home Depot 524,869 364,582 116,674 88,873 27,801 2,251 187 25,737 7,981 17,756 Rona 27,686 16,538 11,148 8,482 2,661 425 (134) 2,102 767 1,198 Lowes 74,452 62,583 20,271 19,526 745 141 198) 506 161 274 Home Hardware 12,148 7,432 4,716 3,371 1,345 160 APT ART INVT C2C (Weeks! 1,185 450 735 7,781 6,768 43,803 59,940 116,681 20,497 5,987 203,105 1,836 565 5,308 7,876 8,196 3,743 615 20,991 8,658 5,865 7,411 24,625 10,949 2,655 1,930 40,159 1,285 3,215 1,360 5,081 2,579 175 254 8,089 1 Comparison of Firm Performance 2 3 Net operating revenues 4 Cost of goods sold 5 Gross profit 6 Selling, general, and administrative expense 7 Operating income 8 Interest expense 9 Other income (loss) - net 10 Income before income taxes 11 Income taxes 12 Net income 13 Assets 14 Cash and cash equivalents 15 Net receivables 16 Inventories 17 Total current assets 18 Property, plant and equipment 19 Goodwill 20 Other assets 21 Total assets 22 Liabilities and Stockholder Equity 23 Accounts payable 24 Short-term debt 25 Total current liability 26 Long term debt 27 Total liabilities 28 Stockholder equity 29 30 31 32 33 34 35 36 37 38 39 40 41 42 43 44 Q1- Forecast Q4-Financial 21,821 1,011 7 59,099 12,719 71,818 41,417 126,243 76,343 4,951 124 5,075 6,806 14,940 6,051 3,191 20,413 9,746 3,124 6,176 1,913 Q7- Network Design Q8-APS + S April 100 * AC 25 GAN 24,725 GPS 989 195 RA 23 209,000 200.000 100 1, 119,99 160,190 Total Cast Q1 - Forecast Q4-Financial 7- Network Design Q8-APS F4 x fx A B C D E F Dallas $95.00 $88.00 1 2 Per Unit Freight Costs, From the proposed plants, to each destination 3 Philadelphia Atlanta 4 Plant A $94.00 $83.00 5 Plant B $75.00 $88.00 6 7 Cost to Build Each Plant 8 Cost to Build 9 Plant A $23,500.00 10 Plant B $29,000.00 11 12 Annual Demand, in units, Shipped to each city, Assume Demand Does Not Change, Over 3 years 13 Philadelphia Atlanta 14 Demand (#Units) 100 50 Dallas 125 15 16 17 18 19 20 21 22 23 24 25 26 27 28 29 30 31 32 33 34 35 36 37 38 39 40 41 42 43 Q1- Forecast Q4-Financial Q7- Network Design Q8-APS + B C D F G H K L Performance Metrics Home Depot Rona Lowes Home Hardware Home Depot 524,869 364,582 116,674 88,873 27,801 2,251 187 25,737 7,981 17,756 Rona 27,686 16,538 11,148 8,482 2,661 425 (134) 2,102 767 1,198 Lowes 74,452 62,583 20,271 19,526 745 141 198) 506 161 274 Home Hardware 12,148 7,432 4,716 3,371 1,345 160 APT ART INVT C2C (Weeks! 1,185 450 735 7,781 6,768 43,803 59,940 116,681 20,497 5,987 203,105 1,836 565 5,308 7,876 8,196 3,743 615 20,991 8,658 5,865 7,411 24,625 10,949 2,655 1,930 40,159 1,285 3,215 1,360 5,081 2,579 175 254 8,089 1 Comparison of Firm Performance 2 3 Net operating revenues 4 Cost of goods sold 5 Gross profit 6 Selling, general, and administrative expense 7 Operating income 8 Interest expense 9 Other income (loss) - net 10 Income before income taxes 11 Income taxes 12 Net income 13 Assets 14 Cash and cash equivalents 15 Net receivables 16 Inventories 17 Total current assets 18 Property, plant and equipment 19 Goodwill 20 Other assets 21 Total assets 22 Liabilities and Stockholder Equity 23 Accounts payable 24 Short-term debt 25 Total current liability 26 Long term debt 27 Total liabilities 28 Stockholder equity 29 30 31 32 33 34 35 36 37 38 39 40 41 42 43 44 Q1- Forecast Q4-Financial 21,821 1,011 7 59,099 12,719 71,818 41,417 126,243 76,343 4,951 124 5,075 6,806 14,940 6,051 3,191 20,413 9,746 3,124 6,176 1,913 Q7- Network Design Q8-APS + S April 100 * AC 25 GAN 24,725 GPS 989 195 RA 23 209,000 200.000 100 1, 119,99 160,190 Total Cast Q1 - Forecast Q4-Financial 7- Network Design Q8-APS


