

Question: 4. One semester, the TA for a math class decided to time how long it took her students to finish their Final Exam. Below
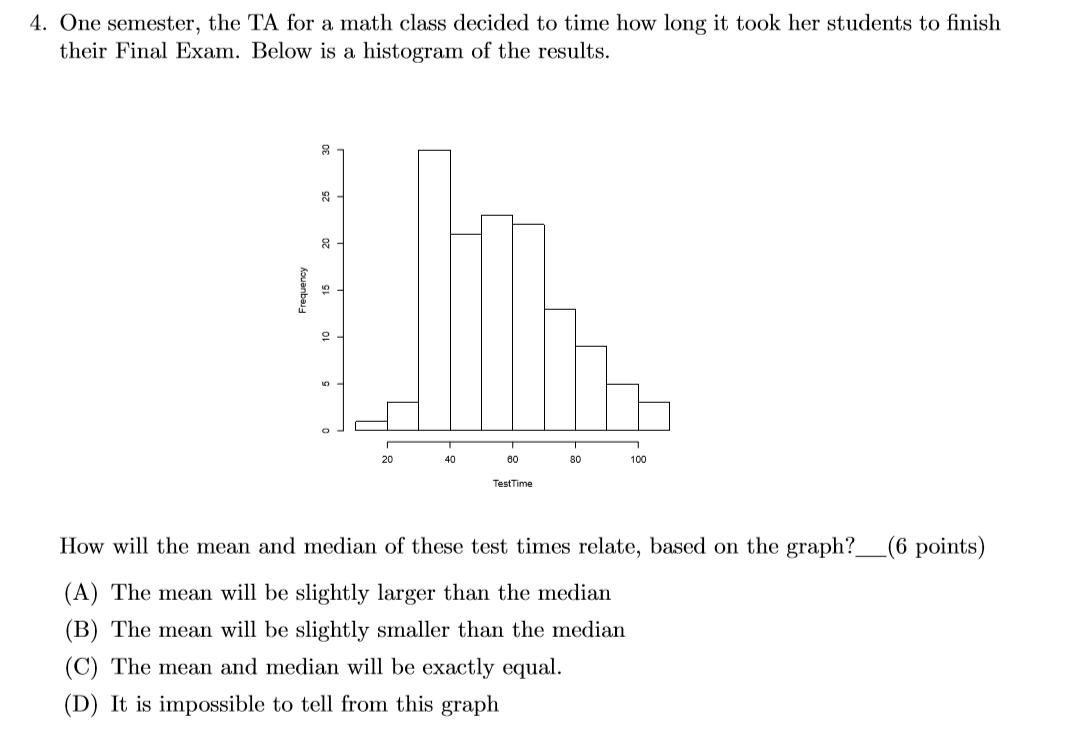
4. One semester, the TA for a math class decided to time how long it took her students to finish their Final Exam. Below is a histogram of the results. 20 40 80 80 100 TestTime How will the mean and median of these test times relate, based on the graph?_(6 points) (A) The mean will be slightly larger than the median (B) The mean will be slightly smaller than the median (C) The mean and median will be exactly equal. (D) It is impossible to tell from this graph
Step by Step Solution
3.43 Rating (159 Votes )
There are 3 Steps involved in it
To determine the relationship between the mean and medi... View full answer

Get step-by-step solutions from verified subject matter experts